From Wikipedia, the free encyclopedia
Part of the 2009 Irish local elections
2009 North Tipperary County Council election|
|
|
|
|
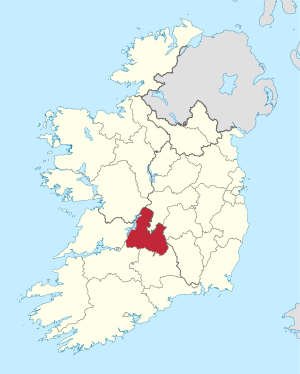 Map showing the area of North Tipperary County Council |
|
|
Council control after election
TBD
| |
An election to North Tipperary County Council took place on 5 June 2009 as part of that year's Irish local elections. 21 councillors were elected from four local electoral areas (LEAs) for a five-year term of office on the electoral system of proportional representation by means of the single transferable vote (PR-STV).[1]
Results by party[edit]
Results by local electoral area[edit]
Nenagh - 6 seats
| Party |
Candidate |
FPv% |
Count
|
| 1 |
2 |
3 |
4 |
5 |
6 |
7 |
8 |
9
|
|
|
Fianna Fáil
|
Jim Casey*
|
13.77
|
1,478
|
1,515
|
1,547
|
|
|
|
|
|
|
|
|
Independent
|
Michael O'Meara*
|
11.95
|
1,282
|
1,285
|
1,316
|
1,316
|
1,343
|
1,601
|
|
|
|
|
|
Fine Gael
|
Gerard Darcy*
|
11.03
|
1,184
|
1,193
|
1,212
|
1,212
|
1,275
|
1,607
|
|
|
|
|
|
Labour
|
Virginia O'Dowd
|
10.47
|
1,123
|
1,148
|
1,264
|
1,267
|
1,350
|
1,374
|
1,379
|
1,479
|
1,502
|
|
|
Independent
|
Hughie McGrath
|
9.13
|
980
|
1,001
|
1,142
|
1,144
|
1,254
|
1,270
|
1,272
|
1,409
|
1,418
|
|
|
Sinn Féin
|
Seamus Morris
|
8.69
|
933
|
955
|
1,033
|
1,036
|
1,083
|
1,096
|
1,098
|
1,230
|
1,241
|
|
|
Fine Gael
|
Louis McCormack
|
7.59
|
815
|
827
|
835
|
835
|
863
|
|
|
|
|
|
|
Fine Gael
|
Tom Moylan
|
7.41
|
795
|
801
|
878
|
879
|
955
|
1,033
|
1,087
|
1,174
|
1,198
|
|
|
Fianna Fáil
|
Michael Comerford
|
6.38
|
685
|
709
|
720
|
722
|
902
|
986
|
996
|
|
|
|
|
Fianna Fáil
|
Tom Harrington*
|
5.81
|
624
|
662
|
707
|
709
|
|
|
|
|
|
|
|
Independent
|
Tony Sheary
|
5.74
|
616
|
621
|
|
|
|
|
|
|
|
|
|
Fianna Fáil
|
Valerie Foley
|
2.01
|
216
|
|
|
|
|
|
|
|
|
| Electorate: 14,628 Valid: 10,731 (73.36%) Spoilt: 111 Quota: 1,534 Turnout: 10,842 (74.12%)
|
Newport[edit]
Newport - 5 seats
| Party |
Candidate |
FPv% |
Count
|
| 1 |
2 |
3
|
|
|
Fine Gael
|
Phyll Bugler*
|
14.71
|
1,370
|
1,580
|
|
|
|
Labour
|
Jonathan Meaney
|
13.25
|
1,234
|
1,338
|
1,609
|
|
|
Independent
|
John McGrath
|
13.23
|
1,232
|
1,307
|
1,498
|
|
|
Fianna Fáil
|
Mattie (Coole) Ryan*
|
12.58
|
1,172
|
1,355
|
1,571
|
|
|
Independent
|
Martin Kennedy
|
12.36
|
1,151
|
1,215
|
1,298
|
|
|
Fine Gael
|
Tom Berkery*
|
12.06
|
1,123
|
1,183
|
|
|
|
Fianna Fáil
|
John Carroll*
|
11.59
|
1,079
|
1,269
|
1,425
|
|
|
Fianna Fáil
|
John Sheehy*
|
8.58
|
799
|
|
|
|
|
Independent
|
Noel Monteith
|
1.64
|
153
|
|
|
| Electorate: 12,885 Valid: 9,313 (72.28%) Spoilt: 93 Quota: 1,553 Turnout: 9,406 (73.00%)
|
Templemore[edit]
Templemore - 5 seats
| Party |
Candidate |
FPv% |
Count
|
| 1 |
2 |
3 |
4 |
5 |
6 |
7
|
|
|
Fianna Fáil
|
Michael Smith*
|
20.36
|
1,791
|
|
|
|
|
|
|
|
|
Fine Gael
|
Pauline Coonan*
|
17.44
|
1,534
|
|
|
|
|
|
|
|
|
Independent
|
Eddie Moran
|
13.96
|
1,228
|
1,260
|
1,313
|
1,335
|
1,347
|
1,470
|
|
|
|
Fine Gael
|
Denis Ryan*
|
12.62
|
1,110
|
1,167
|
1,180
|
1,304
|
1,323
|
1,395
|
1,712
|
|
|
Fianna Fáil
|
John Hogan*
|
10.88
|
957
|
998
|
1,030
|
1,099
|
1,105
|
1,290
|
1,338
|
|
|
Fine Gael
|
Tim Maher
|
9.05
|
796
|
807
|
833
|
847
|
865
|
933
|
976
|
|
|
Labour
|
Thomas Murphy
|
5.10
|
449
|
492
|
540
|
595
|
600
|
624
|
|
|
|
Fianna Fáil
|
Dr. Joe Hennessy*
|
4.63
|
407
|
474
|
493
|
571
|
578
|
|
|
|
|
Fianna Fáil
|
Mark McLoughlin
|
3.59
|
316
|
385
|
389
|
|
|
|
|
|
|
Labour
|
Des Hanna
|
2.36
|
208
|
212
|
|
|
|
|
|
| Electorate: 11,785 Valid: 8,796 (74.64%) Spoilt: 110 Quota: 1,467 Turnout: 8,906 (75.57%)
|
Thurles[edit]
Thurles - 5 seats
| Party |
Candidate |
FPv% |
Count
|
| 1 |
2 |
3 |
4 |
5 |
6 |
7
|
|
|
Fianna Fáil
|
Seamus Hanafin*
|
16.76
|
1,590
|
|
|
|
|
|
|
|
|
Independent
|
Michael Lowry, Jnr*
|
14.09
|
1,336
|
1,396
|
1,501
|
1,626
|
|
|
|
|
|
Independent
|
Jim Ryan*
|
13.60
|
1,290
|
1,348
|
1,456
|
1,735
|
|
|
|
|
|
Labour
|
John Kennedy*
|
10.33
|
980
|
1,147
|
1,267
|
1,387
|
1,454
|
1,466
|
1,638
|
|
|
Fianna Fáil
|
Seán Ryan
|
9.65
|
915
|
940
|
980
|
1,047
|
1,088
|
1,098
|
1,200
|
|
|
Independent
|
Willie Kennedy*
|
9.37
|
889
|
894
|
926
|
947
|
963
|
977
|
|
|
|
Independent
|
Billy Clancy
|
8.01
|
760
|
775
|
855
|
950
|
980
|
989
|
1,483
|
|
|
Independent
|
Noel O'Dwyer
|
7.06
|
670
|
704
|
807
|
|
|
|
|
|
|
Fine Gael
|
Mae Quinn
|
6.63
|
629
|
666
|
|
|
|
|
|
|
|
Labour
|
John Kenehan
|
4.49
|
426
|
|
|
|
|
|
|
| Electorate: 13,017 Valid: 9,485 (72.87%) Spoilt: 76 Quota: 1,581 Turnout: 9,561 (73.45%)
|
References[edit]
External links[edit]


