From Wikipedia, the free encyclopedia
Part of the 2009 Irish local elections
2009 Carlow County Council election|
|
|
|
|
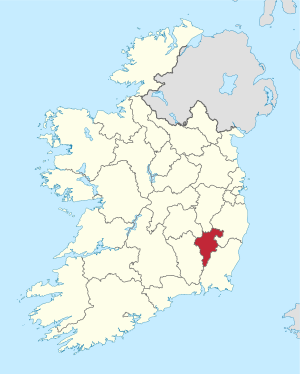 Area of Carlow County Council |
An election to Carlow County Council took place on 5 June 2009 as part of that year's Irish local elections. 21 councillors were elected from five local electoral areas (LEAs) for a five-year term of office on the electoral system of proportional representation by means of the single transferable vote (PR-STV).
Results by party[edit]
Results by local electoral area[edit]
Borris - 4 seats
| Party |
Candidate |
FPv% |
Count
|
| 1 |
2 |
3 |
4 |
5 |
6
|
|
|
Fine Gael
|
Tommy Kinsella*
|
22.64
|
1,238
|
|
|
|
|
|
|
|
Labour
|
Willie Quinn*
|
18.67
|
1,021
|
1,064
|
1,079
|
1,230
|
|
|
|
|
Independent
|
Charlie Murphy
|
15.00
|
820
|
838
|
885
|
925
|
958
|
1,017
|
|
|
Fine Gael
|
John Murphy
|
14.90
|
815
|
870
|
916
|
972
|
1,017
|
1,077
|
|
|
Fianna Fáil
|
P.J. Kavanagh*
|
11.59
|
634
|
639
|
659
|
687
|
692
|
932
|
|
|
Fianna Fáil
|
Dolores Barron
|
7.97
|
436
|
447
|
455
|
491
|
507
|
|
|
|
Green
|
Alan Price*
|
6.11
|
334
|
345
|
361
|
|
|
|
|
|
Independent
|
Billy Nolan
|
3.11
|
170
|
171
|
|
|
|
|
| Electorate: 8,722 Valid: 5,468 (62.69%) Spoilt: 68 Quota: 1,094 Turnout: 5,536 (63.47%)
|
Carlow East[edit]
Carlow West[edit]
Carlow West - 5 seats
| Party |
Candidate |
FPv% |
Count
|
| 1 |
2 |
3 |
4 |
5 |
6 |
7
|
|
|
Fine Gael
|
Michael Abbey*
|
21.32
|
864
|
|
|
|
|
|
|
|
|
Fine Gael
|
Tom O'Neill
|
14.96
|
606
|
686
|
|
|
|
|
|
|
|
Independent
|
Walter Lacey*
|
13.13
|
532
|
557
|
598
|
671
|
725
|
|
|
|
|
Fianna Fáil
|
Ann Ahern (née Long)
|
13.10
|
531
|
556
|
603
|
837
|
|
|
|
|
|
Sinn Féin
|
John Cassin
|
11.20
|
454
|
463
|
503
|
534
|
558
|
564
|
564
|
|
|
Labour
|
Des Hurley*
|
10.93
|
443
|
467
|
487
|
519
|
553
|
574
|
584
|
|
|
Fianna Fáil
|
Rody Kelly*
|
9.13
|
370
|
387
|
440
|
|
|
|
|
|
|
Fianna Fáil
|
Lorraine Hynes*
|
3.65
|
148
|
152
|
|
|
|
|
|
|
|
Independent
|
Ken Murnane
|
2.57
|
104
|
108
|
|
|
|
|
|
| Electorate: 8,231 Valid: 4,052 (49.23%) Spoilt: 55 Quota: 676 Turnout: 4,107 (49.90%)
|
Muinebheag[edit]
Muinebheag - 4 seats
| Party |
Candidate |
FPv% |
Count
|
| 1 |
2 |
3 |
4 |
5 |
6 |
7
|
|
|
Labour
|
Jim Townsend*
|
20.07
|
1,050
|
|
|
|
|
|
|
|
|
Fine Gael
|
Denis Foley*
|
19.75
|
1,033
|
1,061
|
|
|
|
|
|
|
|
Fine Gael
|
Michael Doran*
|
16.42
|
859
|
882
|
886
|
887
|
962
|
1,012
|
1,177
|
|
|
Fianna Fáil
|
Arthur McDonald*
|
13.38
|
700
|
722
|
724
|
724
|
746
|
875
|
978
|
|
|
Fianna Fáil
|
Eddie Cullen
|
9.39
|
491
|
501
|
502
|
503
|
525
|
569
|
605
|
|
|
Labour
|
Liam O'Brien
|
6.73
|
352
|
379
|
384
|
385
|
426
|
508
|
|
|
|
Independent
|
David O'Brien*
|
6.16
|
322
|
359
|
360
|
360
|
406
|
|
|
|
|
Independent
|
Martin Nevin
|
4.32
|
226
|
259
|
260
|
260
|
|
|
|
|
|
Independent
|
James Lakes
|
3.48
|
182
|
|
|
|
|
|
|
|
|
Independent
|
Patrick Rooney
|
0.31
|
16
|
|
|
|
|
|
|
| Electorate: 8,751 Valid: 5,231 (59.78%) Spoilt: 80 Quota: 1,047 Turnout: 5,311 (60.69%)
|
Tullow - 4 seats
| Party |
Candidate |
FPv% |
Count
|
| 1 |
2 |
3 |
4
|
|
|
Fianna Fáil
|
John Pender*
|
26.34
|
1,168
|
|
|
|
|
|
Fine Gael
|
Pat Deering
|
17.66
|
783
|
818
|
959
|
|
|
|
Fine Gael
|
Pat O'Toole
|
15.92
|
706
|
756
|
818
|
827
|
|
|
Labour
|
William Paton*
|
15.63
|
693
|
750
|
850
|
864
|
|
|
Fine Gael
|
Fred Hunter*
|
14.21
|
630
|
658
|
763
|
812
|
|
|
Fianna Fáil
|
Sophie Kelly
|
10.24
|
454
|
565
|
|
|
| Electorate: 7,928 Valid: 4,434 (55.93%) Spoilt: 67 Quota: 887 Turnout: 4,501 (56.77%)
|
External links[edit]


