User:Gamble1993
 | This is a Wikipedia user page. This is not an encyclopedia article or the talk page for an encyclopedia article. If you find this page on any site other than Wikipedia, you are viewing a mirror site. Be aware that the page may be outdated and that the user whom this page is about may have no personal affiliation with any site other than Wikipedia. The original page is located at https://en.wikipedia.org/wiki/User:Gamble1993. |
| No. | Portrait | Name (Birth–Death) |
Term | Party | Election | Vice President | |
|---|---|---|---|---|---|---|---|
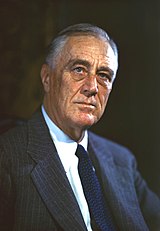
| 32 | 
|
Franklin D. Roosevelt (1882–1945) |
March 4, 1933 – April 12, 1945 |
Democratic | 1932
|
John Nance Garner
| |
| 33 | 
|
Harry S. Truman (1884–1972) |
April 12, 1945 – January 20, 1949 |
Democratic | – | Vacant through January 20, 1949 | |
| 34 | 
|
Thomas E. Dewey (1902–1950) |
January 20, 1949 – November 1, 1950 |
Republican | 1948 | Earl Warren | |
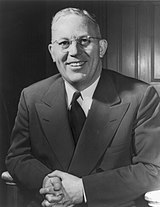
| 35 | 
|
Earl Warren (1891–1974) |
November 1, 1950 – January 20, 1953 |
Republican | – | Vacant through January 20, 1953 | |
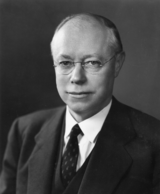
| 36 | 
|
Robert A. Taft (1889–1953) |
January 20, 1953 – July 31, 1953 |
Republican | 1952 | William Knowland | |
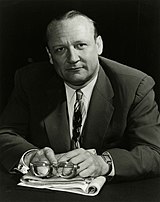
| 37 | 
|
William Knowland (1908–1974) |
July 31, 1953 – January 20, 1957 |
Republican | 1954 | Vacant through January 20, 1957 | |
| 38 | 
|
Estes Kefauver (1903–1962) |
January 20, 1957 – August 8, 1962 |
Democratic | 1956
|
Paul A. Dever
Vacant after | |
RW Europe 2000's[edit]
2004 Saarland state election[edit]
| Party | Votes | % | +/- | Seats | +/- | Seats % | |
|---|---|---|---|---|---|---|---|
| Christian Democratic Union (CDU) | 202,016 | 45.7 | 27 | 52.9 | |||
| Social Democratic Party (SPD) | 128,550 | 29.1 | 17 | 35.3 | |||
| National Democratic Party (NPD) | 35,180 | 8.0 | 4 | 0 | |||
| Family Party of Germany (FAMILIE) | 26,212 | 5.9 | 3 | 0 | |||
| Alliance 90/The Greens (Grüne) | 17,156 | 3.9 | 0 | 0 | |||
| Free Democratic Party (FDP) | 15,168 | 3.4 | 0 | 0 | |||
| Party of Democratic Socialism (PDS) | 10,240 | 2.3 | 0 | ±0 | 0 | ||
| Others | 7,106 | 1.6 | 0 | ±0 | 0 | ||
| Total | 441,628 | 100.0 | 51 | ±0 | |||
| Voter turnout | 55.5 | ||||||
2004 Brandenburg state election[edit]
| Party | Votes | % | +/- | Seats | +/- | Seats % | ||||
|---|---|---|---|---|---|---|---|---|---|---|
| Social Democratic Party (SPD) | 349,262 | 31.9 | 29 | 37.5 | ||||||
| Party of Democratic Socialism (PDS) | 326,801 | 28.0 | 25 | 33.0 | ||||||
| Christian Democratic Union (CDU) | 227,062 | 19.4 | 17 | 22.7 | ||||||
| German People's Union (DVU) | 71,041 | 6.0 | 12 | 6.8 | ||||||
| Family Party (FAMILIE) | 30,843 | 2.6 | 5 | 0 | ||||||
| Alliance 90/The Greens (Grüne) | 42,091 | 3.6 | 0 | ±0 | 0 | |||||
| Free Democratic Party (FDP) | 38,890 | 3.3 | 0 | ±0 | 0 | |||||
| Others | 59,239 | 5.1 | 0 | ±0 | 0 | |||||
| Total | 1,168,909 | 100.0 | 88 | |||||||
| Voter turnout | 56.4 | |||||||||
2004 Saxony state election[edit]
| Party | Votes | % | +/- | Seats | +/- | Seats % | ||||
|---|---|---|---|---|---|---|---|---|---|---|
| Christian Democratic Union (CDU) | 855,203 | 41.1 | 55 | 44.4 | ||||||
| Party of Democratic Socialism (PDS) | 490,488 | 23.6 | 30 | 25.0 | ||||||
| National Democratic Party (NPD) | 190,909 | 9.2 | 25 | 9.7 | ||||||
| Social Democratic Party (SPD) | 204,438 | 9.8 | 11 | 10.5 | ||||||
| Free Democratic Party (FDP) | 122,605 | 5.9 | 0 | 5.6 | ||||||
| Alliance 90/The Greens (Grüne) | 106,771 | 5.1 | 0 | 4.8 | ||||||
| Human Environment Animal Protection (Tierschutz) | 34,068 | 1.6 | 0 | ±0 | 0 | |||||
| Others | 75,652 | 3.6 | 0 | ±0 | 0 | |||||
| Total | 2,080,135 | 100.0 | 121 | |||||||
| Voter turnout | 59.6 | |||||||||
2006 Mecklenburg-Vorpommern state election[edit]
| Party | Votes | % | +/- | Seats | +/- | Seats % | ||||
|---|---|---|---|---|---|---|---|---|---|---|
| Social Democratic Party (SPD) | 232,351 | 28.4 | 22 | 31.0 | ||||||
| Christian Democratic Union (CDU) | 220,569 | 27.0 | 21 | 29.6 | ||||||
| Party of Democratic Socialism (PDS) | 122,292 | 15.0 | 11 | 15.5 | ||||||
| National Democratic Party (NPD) | 119,690 | 14.6 | 11 | 15.5 | ||||||
| Free Democratic Party (FDP) | 63,479 | 7.8 | 6 | 8.5 | ||||||
| Alliance 90/The Greens (Grüne) | 27,642 | 3.4 | 0 | ±0 | 0 | |||||
| Family Party (Familie) | 9,463 | 1.2 | 0 | ±0 | 0 | |||||
| Others | 22,756 | 2.8 | 0 | ±0 | 0 | |||||
| Total | 818,061 | 100.0 | 71 | ±0 | ||||||
| Voter turnout | 59.2 | |||||||||
