User:BitterGiant/sandbox

From Wikipedia, the free encyclopedia
2010 United Kingdom general election

← 2006 6 April 2010 (2010-04-06) 2014 →

All 650 seats in the House of Commons
326 seats needed for a majority
Opinion polls
Turnout65.3% (Increase2.7%)
  First party Second party Third party
  David Cameron Gordon Brown Nick Clegg
Leader Matt Ross Francis Mullins Peter Harvey
Party Liberal Progressives National Unionist
Leader since 14 October 2006 21 March 2004 2 March 2007
Leader's seat Portsmouth South Liverpool Walton Strangford
Last election 161 seats, 36.3% 367 seats, 37.6% 89 seats, 23.0%
Seats won 423 193 11
Seat change Increase 262 Decrease 174 Decrease 78
Popular vote 9,271,941 5,637,662 6,220,384
Percentage 32.0% 19.4% 21.4%
Swing Decrease 4.3 pp Decrease 18.2 pp Decrease 1.6 pp

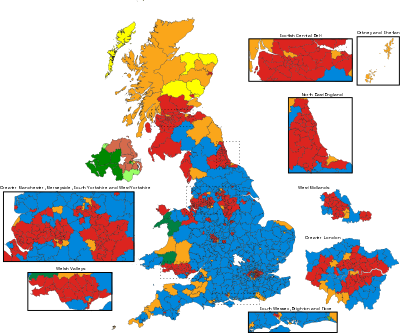
Colours denote the winning party, as shown in the main table of results

Composition of the House of Commons after the election

Prime Minister before election

Francis Mullins
Progressives

Prime Minister after election

Matt Ross
Liberal


2014 United Kingdom general election

← 2010 3 April 2014 (2014-04-03) 2018 →

All 650 seats in the House of Commons
326 seats needed for a majority
Opinion polls
Turnout66.4% (Increase1.1%)
  First party Second party Third party
  David Cameron Gordon Brown David Cameron
Leader Mostyn Madison Julia Bloch Matt Ross
Party Reformist Progressives Liberal
Leader since 14 July 2009 27 May 2010 14 October 2006
Leader's seat Romford Lewisham Deptford Portsmouth South
Last election 0 seats, 10.2% 193 seats, 19.4% 423 seats, 32.0%
Seats won 229 211 138
Seat change Increase 229 Increase 18 Decrease 285
Popular vote 6,736,184 6,877,606 6,410,647
Percentage 22.5% 22.9% 21.4%
Swing Increase 12.3% Increase 3.5% Decrease 10.6%

  Fourth party Fifth party
  Gordon Brown Nick Clegg
Leader Colin Rapson Peter Harvey
Party New Left Alliance National Unionist
Leader since 2 March 2007
Leader's seat Ran in Halton (lost)

Strangford
Last election 0 seats, 11.2% 11 seats, 21.4%
Seats won 45 12
Seat change Increase 45 Increase
Popular vote 4,322,366 4,457,618
Percentage 14.4% 14.9%
Swing Increase 3.2% Decrease 6.5 pp

Colours denote the winning party, as shown in the main table of results

Composition of the House of Commons after the election

Prime Minister before election

Matt Ross
Liberal

Prime Minister and Deputy Prime Minister after negotiations

Julia Bloch (Progressives)
Matt Ross (Liberal)


2018 United Kingdom general election

← 2014 5 April 2018 (2018-04-05) 2022 →

All 650 seats in the House of Commons
326 seats needed for a majority
Opinion polls
Turnout68.8% (Increase2.4%)
  First party Second party
  Gordon Brown David Cameron
Leader Julia Bloch (Prog.)
Matt Ross (Lib)
Mostyn Madison
Party Coalition Reformist
Leader since 27 May 2010 (Bloch)
14 October 2006 (Ross)
14 July 2009
Leader's seat Lewisham Deptford (Bloch)
Portsmouth South (Ross)
Romford
Last election 349 seats, 44.3%[n 1] 229 seats, 22.5%
Seats won 460 108
Seat change Increase 111 Decrease 121
Popular vote 14,247,485 9,053,408
Percentage 44.2% 28.1%
Swing Decrease 0.2% Increase 5.6%

  Third party Fourth party
  Gordon Brown Nick Clegg
Leader Colin Rapson Doug Macauley
Party New Left Alliance National Unionist
Leader since 22 June 2016
Leader's seat Glasgow East Lagan Valley
Last election 45 seats, 14.4% 12 seats, 14.9%
Seats won 63 9
Seat change Increase 18 Decrease 3
Popular vote 7,221,775 375,596
Percentage 22.4% 1.2%
Swing Increase 8.0% Decrease 13.7 pp

Colours denote the winning party, as shown in the main table of results

Composition of the House of Commons after the election

Prime Minister and Deputy Prime Minister before election

Julia Bloch (Progressives)
Matt Ross (Liberal)
Coalition

Elected Prime Minister and Deputy Prime Minister

Julia Bloch (Progressives)
Matt Ross (Liberal)
Coalition


2022 United Kingdom general election

← 2018 7 April 2022 (2022-04-07) Next →

All 650 seats in the House of Commons
326 seats needed for a majority
Opinion polls
Turnout67.3% (Decrease1.5%)
  First party Second party Third party
  David Cameron
Lorna Slater MSP and Patrick Harvie MSP.jpg
Gordon Brown
Leader Mostyn Madison Suzy Thomas (Prog.)
David Atwood (Lib)
Jo Burns
Party Reformist Coalition SNP
Leader since 14 July 2009 15 July 2021 (Smyth)
27 November 2018 (Atwood)
27 September 2019
Leader's seat Romford Gower (Thomas)
Guildford (Atwood)
Did not stand
Last election 108 seats, 28.1% 460 seats, 44.2% 0 seats, 2.0%
Seats won 321 281 23
Seat change Increase 213 Decrease 179 Increase 23
Popular vote 12,661,036 13,590,781 770,590
Percentage 39.6% 42.5% 2.4%
Swing Increase 11.5% Decrease 1.7% Increase 0.4%

  Fourth party Fifth party Sixth party
  Nick Clegg Gordon Brown Gordon Brown
Leader Doug Macauley Dafydd Bowen Colin Rapson
Party National Unionist Plaid Cymru New Left Alliance
Leader since 22 June 2016 22 June 2013
Leader's seat Lagan Valley Arfon Glasgow East (defeated)
Last election 9 seats, 1.2% 3 seats, 0.5% 63 seats, 22.4%
Seats won 10 4 3
Seat change Increase 1 Increase 1 Decrease 60
Popular vote 337,250 153,265 3,688,946
Percentage 1.1% 0.5% 11.5%
Swing Decrease 0.1% Steady Decrease 10.9%

Colours denote the winning party, as shown in the main table of results

Composition of the House of Commons after the election

Prime Minister and Deputy Prime Minister before election

David Atwood (Liberal)
Suzy Thomas (Progressives)
Coalition

Elected Prime Minister and Deputy Prime Minister

Mostyn Madison (Reformist)
Doug Macauley (Unionist)
Reformist & Unionist


Cite error: There are <ref group=n> tags on this page, but the references will not show without a {{reflist|group=n}} template (see the help page).