User:Uwappa
18:01, 23 November 2024 UTC [refresh]
Today's motto...
Today's featured picture

|
The Finding in the Temple, also called Christ among the Doctors, the Disputation in the Temple and variations of those names, is an episode in the early life of Jesus depicted in chapter 2 of the Gospel of Luke. It is the only event of the later childhood of Jesus mentioned in a canonical gospel. In the episode, Jesus – at the age of twelve – accompanies Mary, Joseph, and a large group of their relatives and friends to Jerusalem on many pilgrimages. On the day of their return, Jesus remained in the Temple. Mary and Joseph returned home believing he was among their group when he was not. After a day of travel they realised Jesus was missing and returned to Jerusalem, finding him three days later. He was found in the Temple in discussion with the elders, "listening to them and asking them questions". When admonished by Mary, Jesus replied: "How is it that you sought me? Did you not know that I must be in my Father's house?" The Finding in the Temple is frequently shown in art. This representation, titled The Finding of the Saviour in the Temple, is an oil-on-canvas painting produced by William Holman Hunt in 1860. It now hangs in the Birmingham Museum and Art Gallery in Birmingham, England. Painting credit: William Holman Hunt
Recently featured:
|
About
[edit]| Uwappa creates a web to save Banjora from the mundurras in an Ngarrindjeri dreaming story. |
| This user has experienced guidance from Yurluggur. |
| This user is not yet dead. Please check back later... |
| This user loves the Kurangk. |
| This user has enjoyed the hospitality of the Ngarrindjeri. |
| wgu-0 | This user has learnt a few words of Wirangu. |
| This user felt at home in Nantawarrina, Adnyamathanha land. |
| This user thanks the Yolŋu for sharing basic Aboriginal culture. |
| This user loves dragon dreaming. |
Toolbox
[edit]
Climate |
|
|---|---|
| The core of the human eye can read
|
|

|
|
| Colours | |

Graphs |
|

Edit |
|

Wikipedia |
|

Body Roundness |
Body Roundness Calculator[edit]Development Tools[edit]
General Calculator stuff[edit]
Wikitext[edit]Body Roundness[edit] |
Graphs
[edit]I love it how Aboriginal paintings depict a whole story.
Good graphs can also tell a story, as Edward Tufte describes in his books on data visualization.
Global warming
[edit]-
Daily Sea Surface Temperatures 60S-60N 1979-2023
This Copernicus graph is a jewel. It is a graph that tells a whole story in an instant.
The blue, white, red lines are like waves of an ocean. The colours seem to show increasing temperature, yet actually show time, decades of data. Time and temperature coincide.
2023 jumps out of the waves, is out of bandwidth. Oceans are warming.
Climate change graphs
[edit]-
A Péguy climograph shows average temperature and precipitation of a climate per month.
-
Change of climate and its impact, with red for impossible agriculture.
-
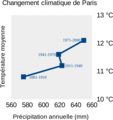
120 years of climate change in Paris.
-
Climate change in Paris 1881-2000.
-
Impact
Climate tipping point +1.5 °C
[edit]-
The 20 year average is expected to cross +1.5 °C in 2032.
-
In 2000 the tipping point was expected in 2045. In 2024 the expectation was 2032.
Polls
[edit]This chart tells the story of an election or poll. What are the changes since the previous election?
- new party.
- party that gained seats.
- party maintained seats, did not win, did not lose.
- Party lost seats. The top of is the result in the previous election.
- party lost all seats.
Collatz conjecture
[edit]:( Graph module down
[edit]| Graphs are unavailable due to technical issues. There is more info on Phabricator and on MediaWiki.org. |


