
Timeline of the 1995 Atlantic hurricane season
| Timeline of the 1995 Atlantic hurricane season | |||||
|---|---|---|---|---|---|
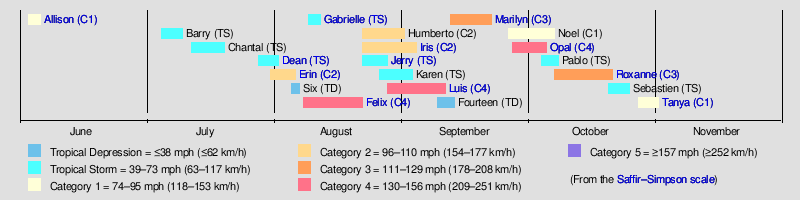
 Season summary map | |||||
| Season boundaries | |||||
| First system formed | June 2, 1995 | ||||
| Last system dissipated | November 1, 1995 | ||||
| Strongest system | |||||
| Name | Opal | ||||
| Maximum winds | 150 mph (240 km/h) (1-minute sustained) | ||||
| Lowest pressure | 916 mbar (hPa; 27.05 inHg) | ||||
| Longest lasting system | |||||
| Name | Felix | ||||
| Duration | 14.75 days | ||||
| |||||
The 1995 Atlantic hurricane season was an event in the annual tropical cyclone season in the north Atlantic Ocean. This Atlantic hurricane season saw a near-record number of named tropical storms. This extremely active season followed four consecutive years in which there was below normal activity.[1][nb 1] The season officially began on June 1, 1995 and ended on November 30, 1995. These dates, adopted by convention, historically describe the period in each year when most tropical systems form.[3] The season's first system, Hurricane Allison, developed on June 3; its last, Hurricane Tanya, became extratropical on November 2.
The season produced 21 tropical cyclones, of which 19 intensified into tropical storms, 11 of which became hurricanes, and five became major hurricanes.[4][nb 2] The four most notable storms during the season were hurricanes Luis, Marilyn, Opal and Roxanne. Luis caused extensive damage in the northern Leeward Islands in excess of $2.5 billion (1995 USD).[4] Marilyn affected the same area a few days later, causing eight deaths and damages in excess of $2 billion in the U.S. Virgin Islands.[6] Opal was a strong hurricane that, after battering the Yucatán Peninsula of Mexico, cross the Gulf of Mexico and made landfall near Pensacola Beach, Florida. There were 27 hurricane-related deaths were reported in the Southeastern United States.[7] Roxanne caused widespread flooding and crop damage throughout much of the Yucatán Peninsula, and killed at least six people, due to its erratic movement.[8] Following the 1995 season, these four storm names were retired from reuse in the North Atlantic by the World Meteorological Organization.[9]
This timeline documents tropical cyclone formations, strengthening, weakening, landfalls, extratropical transitions, and dissipations during the season. It includes information that was not released throughout the season, meaning that data from post-storm reviews by the National Hurricane Center, such as a storm that was not initially warned upon, has been included.
By convention, meteorologists use one time zone when issuing forecasts and making observations: Coordinated Universal Time (UTC), and also use the 24-hour clock (where 00:00 = midnight UTC).[10] In this time line, all information is listed by UTC first with the respective local time included in parentheses.
Timeline[edit]
June[edit]
June 1
- The 1995 Atlantic hurricane season officially begins.[3]
June 3
- 00:00 UTC (8:00 p.m. EDT, June 2) – Tropical Depression One develops from a tropical wave roughly 230 miles (370 km) east of Belize City, Belize.[11]
- 12:00 UTC (8:00 a.m. EDT) – Tropical Depression One strengthens into Tropical Storm Allison while moving through the Yucatán Channel.[11]

June 4
- 12:00 UTC (8:00 a.m. EDT) – Tropical Storm Allison intensifies into a Category 1 hurricane while located about 280 miles (440 km) west of Key West, Florida and simultaneously reaches its peak intensity with maximum sustained winds of 75 miles per hour (121 km/h) and a minimum barometric pressure of 987 mbar (29.1 inHg).[nb 3][11]
June 5
- 06:00 UTC (2:00 a.m. EDT) – Hurricane Allison weakens to a tropical storm as it approaches the Florida Gulf coast.[11]
- 14:00 UTC (10:00 a.m. EDT) – Tropical Storm Allison makes initial landfall near Alligator Point, Florida with winds of 70 mph (110 km/h).[11]
- 15:00 UTC (11:00 a.m. EDT) – Tropical Storm Allison again makes landfall, after moving over water, near Saint Marks, Florida with winds of 65 miles per hour (105 km/h).[11]
June 6
- 00:00 UTC (8:00 p.m. EDT June 5) – Tropical Storm Allison weakens to a tropical depression over southeastern Georgia.[11]
- 06:00 UTC (2:00 a.m. EDT) – Tropical Depression Allison transitions into an extratropical cyclone while tracking across the Carolinas, and subsequently dissipates over the Labrador Sea.[11]
July[edit]
July 6
- 18:00 UTC (2:00 p.m. AST) – Tropical Depression Two forms from a frontal low-pressure area while located about 425 mi (685 km) west of Bermuda.[12]

July 7
- 06:00 UTC (2:00 a.m. AST) – Tropical Depression Two intensifies into Tropical Storm Barry while located west-southwest of Bermuda.[12]
- 21:00 UTC (5:00 p.m. AST) – Tropical Storm Barry attains its maximum sustained wind speed of 70 miles per hour (110 km/h).[12]
July 9
- 21:30 UTC (5:30 p.m. AST) – Tropical Storm Barry makes landfall near Hart Island, Nova Scotia (south of Canso) with winds of 60 miles per hour (97 km/h).[12]
- 22:00 UTC (6:00 p.m. AST) – Tropical Storm Barry again makes landfall, after moving over water, near L'Ardoise, Nova Scotia on Cape Breton Island with winds of 50 miles per hour (80 km/h).[12]
July 10
- 00:00 UTC (8:00 p.m. AST, July 9) – Tropical Storm Barry attains its minimum barometric pressure of 990 mbar (29 inHg) while over the Gulf of Saint Lawrence.[12]
- 06:00 UTC (2:00 a.m. AST) – Tropical Storm Barry transitions into an extratropical cyclone near the western coast of Newfoundland and later dissipates.[12]
July 12
- 00:00 UTC (8:00 p.m. AST, July 11) – Tropical Depression Three forms from a tropical wave while located a few hundred miles east of the Lesser Antilles.[13]
July 14
- 00:00 UTC (8:00 p.m. AST, July 13) – Tropical Depression Three intensifies into a Tropical Storm Chantal while located 230 miles (370 km) north-northeast of Puerto Rico.[13]
July 17
- 00:00 UTC (8:00 p.m. AST, July 16) – Tropical Storm Chantal reaches its peak intensity while located west of Bermuda with maximum sustained winds of 70 miles per hour (110 km/h) and a minimum barometric pressure of 991 mbar (29.3 inHg).[13]
July 20
- 18:00 UTC (2:00 p.m. AST) – Tropical Storm Chantal transitions into an extratropical cyclone roughly 225 miles (360 km) east-southeast of Cape Race, Newfoundland and subsequently dissipates.[13]
July 28
- 18:00 UTC (1:00 p.m. CDT) – Tropical Depression Four forms from a middle-level trough roughly 350 miles (560 km) southeast of New Orleans, Louisiana.[14]

July 30
- 18:00 UTC (1:00 p.m. CDT) – Tropical Depression Four intensifies into Tropical Storm Dean while located roughly 70 miles (110 km) from the Southeast Texas Gulf coast.[14]
July 31
- 00:00 UTC (7:00 p.m. CDT, July 30) – Tropical Storm Dean reaches its peak intensity with maximum sustained winds of 45 miles per hour (72 km/h) and a minimum barometric pressure of 999 mbar (29.5 inHg).[14]
- 00:00 UTC (8:00 p.m. EDT, July 30) – Tropical Storm Erin forms from a tropical wave just west of Turks and Caicos Islands.[15]
- 02:00 UTC (9:00 p.m. CDT, July 30) – Tropical Storm Dean makes landfall near Freeport, Texas with winds of 45 miles per hour (72 km/h).[14]
- 06:00 UTC (1:00 a.m. CDT) – Tropical Storm Dean weakens to a tropical depression roughly 25 miles (40 km) south-southwest of Houston, Texas and subsequently merges with an extra-tropical frontal zone.[14]
August[edit]
August 1
- 00:00 UTC (8:00 p.m. EDT, July 31) – Tropical Storm Erin intensifies into a Category 1 hurricane near Rum Cay, Bahamas.[15]

August 2
- 06:15 UTC (2:15 a.m. EDT) – Hurricane Erin makes landfall near Vero Beach, Florida with winds of 85 mph (135 km/h).[15]
- 12:00 UTC (8:00 a.m. EDT) – Hurricane Erin weakens to a tropical storm over Central Florida.[15]
August 3
- 00:00 UTC (8:00 p.m. EDT, August 2) – Tropical Storm Erin re-intensifies into a Category 1 hurricane after emerging into the eastern Gulf of Mexico.[15]
- 13:30 UTC (8:30 a.m. CDT) – Hurricane Erin strengthens into a Category 2 hurricane with maximum sustained winds of 100 miles per hour (160 km/h) as its eyewall makes landfall near Fort Walton Beach, Florida.[15]
- 16:00 UTC (11:00 a.m. CDT) – Hurricane Erin weakens into a Category 1 hurricane due to interaction with Santa Rosa Island.[15]
- 16:00 UTC (11:00 p.m. CDT) – Hurricane Erin attains its minimum barometric pressure of 973 mbar (28.7 inHg) as it makes landfall at Pensacola Beach with winds of 85 miles per hour (137 km/h).[15]
August 4
- 00:00 UTC (7:00 p.m. CDT, August 3) – Hurricane Erin weakens to a tropical storm over southeastern Mississippi.[15]
- 12:00 UTC (7:00 a.m. CDT) – Tropical Storm Erin weakens to a tropical depression.[15]
August 5
- 18:00 UTC (1:00 p.m. CDT) – Tropical Depression Six develops over the southwestern Gulf of Mexico from the southern part of the tropical wave that spawned Hurricane Erin.[16]
August 6
- 12:00 UTC (8:00 a.m. EDT) – Tropical Depression Erin merges with an extratropical frontal system over West Virginia.[15]
- 23:00 UTC (6:00 p.m. CDT) – Tropical Depression Six makes landfall near Cabo Rojo, Veracruz with winds of 35 miles per hour (56 km/h).[16]
August 7
- 00:00 UTC (7:00 p.m. CDT, August 6) – Tropical Depression Six attains its peak intensity just inland (near Ozuluama, Veracruz) with a minimum barometric pressure of 1,002 mbar (29.6 inHg).[16]
- 18:00 UTC (1:00 p.m. CDT) – Tropical Depression Six dissipates over the mountains of central-southern Mexico.[16]
August 8
- 00:00 UTC (8:00 p.m. AST, August 7) – Tropical Depression Seven forms from a tropical wave roughly 460 miles (740 km) west-southwest of the Cape Verde Islands.[17]
- 18:00 UTC (2:00 p.m. AST) – Tropical Depression Seven intensifies into Tropical Storm Felix.[17]
August 9
- 18:00 UTC (1:00 p.m. CDT) – Tropical Depression Eight forms from a tropical wave roughly 180 miles (290 km) east of La Pesca, Tamaulipas.[18]
August 10
- 12:00 UTC (7:00 a.m. CDT) – Tropical Depression Eight intensifies into Tropical Storm Gabrielle.[18]
August 11
- 00:00 UTC (8:00 p.m. AST, August 10) – Tropical Storm Felix intensifies into a Category 1 hurricane roughly 580 miles (930 km) east-northeast of the Leeward Islands.[17]
- 18:00 UTC (2:00 p.m. AST) – Hurricane Felix intensifies into a Category 2 hurricane.[17]
- 20:00 UTC (3:00 p.m. CDT) – Tropical Storm Gabrielle reaches its peak intensity with winds of 70 miles per hour (110 km/h) and a minimum barometric pressure of 988 mbar (29.2 inHg) as it makes landfall just south of La Pesca.[18]
August 12
- 00:00 UTC (8:00 p.m. AST, August 11) – Hurricane Felix rapidly intensifies into a Category 3 hurricane.[17]
- 00:00 UTC (7:00 p.m. CDT, August 11) – Tropical Storm Gabrielle weakens to a tropical depression inland and dissipates roughly 150 miles (240 km) south of the Mexico–United States border.[18]
- 12:00 UTC (8:00 a.m. AST) – Hurricane Felix rapidly intensifies into a Category 4 hurricane.[17]
- 18:00 UTC (2:00 p.m. AST) – Hurricane Felix attains its peak intensity while about 585 miles (941 km) south-southeast of Bermuda with winds of 140 miles per hour (230 km/h) and a minimum barometric pressure of 929 mbar (27.4 inHg).[17]

August 13
- 06:00 UTC (2:00 a.m. AST) – Hurricane Felix weakens to a Category 3 hurricane.[17]
- 18:00 UTC (2:00 p.m. AST) – Hurricane Felix weakens to a Category 2 hurricane.[17]
August 14
- 06:00 UTC (2:00 a.m. AST) – Hurricane Felix weakens to a Category 1 hurricane.[17]
August 20
- 06:00 UTC (2:00 a.m. AST) – Hurricane Felix weakens to a tropical storm northeast of Bermuda.[17]
August 22
- 00:00 UTC (8:00 p.m. AST, August 21) – Tropical Depression Nine forms from a tropical wave while situated about 660 miles (1,060 km) west-southwest of the Cape Verde Islands.[19]
- 06:00 UTC (2:00 a.m. AST) – Tropical Depression Nine intensifies into Tropical Storm Humberto.[19]
- 12:00 UTC (8:00 a.m. AST) – Tropical Depression Ten forms from a tropical wave roughly 690 miles (1,110 km) east of the Lesser Antilles.[20]
- 18:00 UTC (2:00 p.m. AST) – Tropical Storm Felix transitions into an extratropical cyclone roughly 350 miles (560 km) east-northeast of Newfoundland.[17]
- 18:00 UTC (2:00 p.m. AST) – Tropical Depression Ten intensifies into Tropical Storm Iris.[20]
- 18:00 UTC (2:00 p.m. EDT) – Tropical Depression Eleven develops from a tropical wave while located just southwest of Andros Island in the Bahamas.[21]
August 23
- 06:00 UTC (2:00 a.m. AST) – Tropical Storm Humberto intensifies into a Category 1 hurricane west of the Cape Verde Islands.[19]
- 12:00 UTC (8:00 a.m. EDT) – Tropical Depression Eleven strengthens into Tropical Storm Jerry about 33 miles (53 km) east of the Atlantic coast of Florida, and simultaneously attains its maximum sustained wind speed of 40 miles per hour (64 km/h).[21]
- 18:00 UTC (2:00 p.m. AST) – Tropical Storm Iris intensifies into a Category 1 hurricane.[20]
- 18:00 UTC (2:00 p.m. EDT) – Tropical Storm Jerry makes landfall near Jupiter, Florida with winds of 40 miles per hour (64 km/h).[21]

August 24
- 18:00 UTC (2:00 p.m. AST) – Hurricane Humberto reaches its peak intensity while located far west of the Cape Verde Islands with maximum sustained winds of 110 miles per hour (180 km/h) and a minimum barometric pressure of 968 mbar (28.6 inHg).[19]
- 18:00 UTC (2:00 p.m. AST) – Hurricane Iris weakens to a tropical storm.[20]
- 18:00 UTC (2:00 p.m. EDT) – Tropical Storm Jerry weakens to a tropical depression along the Gulf coast of Florida, near Homosassa Springs, and simultaneously attains its minimum barometric pressure of 1,002 mbar (29.6 inHg).[21]
August 26
- 00:00 UTC (8:00 p.m. AST, August 25) – Tropical Storm Iris makes landfall on Saint Lucia with winds of 60 miles per hour (97 km/h).[20]
- 12:00 UTC (8:00 a.m. AST) – Tropical Depression Twelve develops from a tropical wave while centered about 580 miles (930 km) west of the Cape Verde Islands.[22]
- 18:00 UTC (2:00 p.m. AST) – Hurricane Humberto weakens to a Category 1 hurricane.[19]
- 18:00 UTC (2:00 p.m. AST) – Tropical Storm Iris makes landfall on Martinique with winds of 45 miles per hour (72 km/h).[20]
August 27
- 09:00–12:00 UTC (5:00–8:00 a.m. AST) – Tropical Storm Iris makes landfall on the islands of Guadeloupe with winds of 50 miles per hour (80 km/h).[20]
- 18:00 UTC (2:00 p.m. AST) – Tropical Storm Iris makes landfall near Montserrat, Antigua with winds of 60 miles per hour (97 km/h).[20]
- 23:00 UTC (7:00 p.m. AST) – Tropical Storm Iris makes landfall on Barbuda with winds of 65 miles per hour (105 km/h).[20]
August 28
- 06:00 UTC (2:00 a.m. EDT) – Tropical Depression Jerry merges with an extratropical trough while situated near the Georgia–South Carolina state line east of Atlanta.[21]
- 06:00 UTC (2:00 a.m. AST) – Tropical Depression Twelve strengthens into Tropical Storm Karen.[22]
- 18:00 UTC (2:00 p.m. AST) – Tropical Storm Iris re-intensifies into a Category 1 hurricane.[20]
- 18:00 UTC (2:00 p.m. AST) – Tropical Depression Thirteen develops from a tropical wave while located approximately 255 miles (410 km) south-southeast of Praia, Cape Verde.[23]
August 29
- 00:00 UTC (8:00 p.m. AST, August 28) – Tropical Storm Karen attains its peak intensity in the central Atlantic with maximum sustained winds of 50 mph (85 km/h) and a minimum barometric pressure of 1,000 mbar (30 inHg).[22]
- 00:00 UTC (8:00 p.m. AST, August 28) – Tropical Depression Thirteen intensifies into Tropical Storm Luis.[23]
August 30
- 18:00 UTC (2:00 p.m. AST) – Tropical Storm Luis intensifies into a Category 1 hurricane.[23]
August 31
- 12:00 UTC (8:00 a.m. AST) – Hurricane Luis intensifies into a Category 2 hurricane.[23]
- 18:00 UTC (2:00 p.m. AST) – Hurricane Humberto weakens to a tropical storm in the central Atlantic.[19]
September[edit]
September 1
- 00:00 UTC (8:00 p.m. AST, August 31) – Hurricane Luis intensifies into a Category 3 hurricane.[23]
- 06:00 UTC (2:00 a.m. AST) – Tropical Storm Humberto becomes absorbed within a larger extratropical low.[19]
- 06:00 UTC (2:00 a.m. AST) – Hurricane Iris reaches its peak intensity several hundred miles southeast of Bermuda with winds of 110 miles per hour (180 km/h) and a minimum barometric pressure of 965 mbar (28.5 inHg).[20]
- 12:00 UTC (8:00 a.m. AST) – Hurricane Luis intensifies into a Category 4 hurricane about 600 nautical miles (1,100 km; 690 mi) east of the Lesser Antilles.[23]
September 2
- 12:00 UTC (8:00 a.m. AST) – Hurricane Iris weakens to a Category 1 hurricane several hundred miles southeast of Bermuda.[20]
- 12:00 UTC (8:00 a.m. AST) – Tropical Storm Karen weakens to a tropical depression while located east of Bermuda.[22]

September 3
- 06:00 UTC (2:00 a.m. AST) – Tropical Depression Karen is absorbed by Hurricane Iris.[22]
- 06:00 UTC (2:00 a.m. AST) – Hurricane Luis attains its maximum sustained wind speed of 140 mph (220 km/h).[23]
September 4
- 06:00 UTC (2:00 a.m. AST) – Hurricane Iris weakens to a tropical storm.[20]
- 12:00 UTC (8:00 a.m. AST) – Tropical Storm Iris transitions into an extratropical cyclone while centered southeast of Newfoundland.[20]
September 5
- 12:00 UTC (8:00 a.m. AST) – Hurricane Luis makes landfall on Barbuda with winds of 130 mph (215 km/h).[23]
September 7
- 18:00 UTC (2:00 p.m. AST) – Hurricane Luis weakens to a Category 3 hurricane.[23]
September 8
- 00:00 UTC (8:00 p.m. AST, September 7) – Hurricane Luis attains its minimum barometric pressure of 935 mbar (27.6 inHg).[23]
September 9
- 00:00 UTC (8:00 p.m. AST, September 8) – Hurricane Luis weakens to a Category 2 hurricane west of Bermuda.[23]
- 12:00 UTC (8:00 a.m. AST) – Tropical Depression Fourteen develops from a tropical wave about halfway between the Cape Verde Islands and the Lesser Antilles.[24]
September 10
- 12:00 UTC (8:00 a.m. AST) – Hurricane Luis weakens to a Category 1 hurricane.[23]
September 11
- 12:00 UTC (8:00 a.m. AST) – Hurricane Luis makes landfall on the Avalon Peninsula of Newfoundland with winds of 90 mph (150 km/h).[23]
- 18:00 UTC (2:00 p.m. AST) – Hurricane Luis transitions into an extratropical cyclone while located northeast of Newfoundland and is subsequently absorbed by a trough near the southern coast of Greenland.[23]
September 12
- 18:00 UTC (2:00 p.m. AST) – Tropical Depression Fifteen develops from a tropical wave while situated roughly 585 miles (941 km) east-southeast of Barbados.[25]
September 13
- 00:00 UTC (8:00 p.m. AST, September 12) – Tropical Depression Fifteen strengthens into Tropical Storm Marilyn.[25]
- 18:00 UTC (2:00 p.m. AST) – Tropical Depression Fourteen dissipates about 495 mi (795 km) south-southeast of Bermuda.[23]
September 14
- 00:00 UTC (8:00 p.m. AST, September 13) – Tropical Storm Marilyn strengthens into a Category 1 hurricane.[25]
- 21:00 UTC (5:00 p.m. AST) – Hurricane Marilyn makes landfall on Dominica with winds of 80 mph (130 km/h).[25]
- 23:00–00:00 UTC (7:00–8:00 p.m. AST) – Hurricane Marilyn's eyewall strikes the islands of Guadeloupe with winds of 80 mph (130 km/h).[25]
September 15
- 18:00 UTC (2:00 p.m. AST) – Hurricane Marilyn strengthens into a Category 2 hurricane.[25]
- 21:00 UTC (5:00 p.m. AST) – Hurricane Marilyn's eyewall strikes Saint Croix, United States Virgin Islands with winds of 100 miles per hour (160 km/h).[25]

September 16
- 04:30 UTC (00:30 a.m. AST) – Hurricane Marilyn's eyewall strikes Saint Thomas, U.S. Virgin Islands with winds of 100 miles per hour (160 km/h).[25]
- 18:00 UTC (2:00 p.m. AST) – Hurricane Marilyn strengthens into a Category 3 hurricane.[25]
September 17
- 03:00 UTC (11:00 p.m. AST, September 16) – Hurricane Marilyn attains its peak intensity 180 mi (290 km) north-northwest of San Juan, Puerto Rico with maximum sustained winds of 115 mph (185 km/h) and a minimum barometric pressure of 949 mbar (28.0 inHg).[26]
- 06:00 UTC (2:00 a.m. AST) – Hurricane Marilyn weakens to a Category 2 hurricane.[25]
- 12:00 UTC (8:00 a.m. AST) – Hurricane Marilyn weakens to a Category 1 hurricane.[25]
September 18
- 00:00 UTC (8:00 p.m. AST, September 17) – Hurricane Marilyn re-strengthens into a Category 2 hurricane several hundred miles (km) south-southwest of Bermuda.[25]
- 18:00 UTC (2:00 p.m. AST) – Hurricane Marilyn weakens to a Category 1 hurricane.[25]
September 21
- 18:00 UTC (2:00 p.m. AST) – Hurricane Marilyn weakens to a tropical storm.[25]
September 22
- 06:00 UTC (2:00 a.m. AST) – Tropical Storm Marilyn became extratropical while about 315 miles (507 km) southeast of Sable Island, Nova Scotia and subsequently merges with a cold front.[25]
September 26
- 18:00 UTC (2:00 p.m. AST) – Tropical Depression Sixteen develops from a tropical wave while centered about 930 miles (1,500 km) west-southwest of the Cape Verde Islands.[27]

September 27
- 12:00 UTC (8:00 a.m. AST) – Tropical Depression Sixteen intensifies into Tropical Storm Noel over the eastern Atlantic.[27]
- 18:00 UTC (2:00 p.m. EDT) – Tropical Depression Seventeen develops from a tropical wave while situated about 80 mi (130 km) south-southeast of Cozumel, Quintana Roo.[28]
September 28
- 00:00 UTC (8:00 p.m. EDT, September 27) – Tropical Depression Seventeen makes landfall in a rural area of Felipe Carrillo Puerto, Quintana Roo with winds of 30 mph (45 km/h).[28]
- 18:00 UTC (2:00 p.m. AST) – Tropical Storm Noel intensifies into a Category 1 hurricane far east of the Lesser Antilles and simultaneously attains its peak intensity with maximum sustained winds of 75 mph (120 km/h) and a minimum barometric pressure of 987 mbar (29.1 inHg).[27]
September 30
- 12:00 UTC (8:00 a.m. AST) – Hurricane Noel weakens to a tropical storm far to the south-southwest of the Azores.[27]
- 12:00 UTC (8:00 a.m. EDT) – Tropical Depression Seventeen strengthens into Tropical Storm Opal over land, while approaching the Gulf coast of the Yucatán Peninsula east-northeast of Mérida, Yucatán.[28]
October[edit]
October 2
- 12:00 UTC (7:00 a.m. CDT) – Tropical Storm Opal strengthens into a Category 1 hurricane in the Bay of Campeche about 185 miles (298 km) west of Mérida.[29]
October 3
- 18:00 UTC (1:00 p.m. CDT) – Hurricane Opal strengthens into a Category 2 hurricane.[28]

October 4
- 00:00 UTC (7:00 p.m. CDT, October 3) – Hurricane Opal strengthens into a Category 3 hurricane.[28]
- 10:00 UTC (5:00 a.m. CDT) – Hurricane Opal strengthens into a Category 4 hurricane about 165 miles (266 km) south of the mouth of the Mississippi River, and simultaneously attains its peak intensity with maximum sustained winds of 150 mph (240 km/h) and a minimum barometric pressure of 916 mbar (27.0 inHg).[28]
- 18:00 UTC (1:00 p.m. CDT) – Hurricane Opal weakens to a Category 3 hurricane.[28]
- 18:00 UTC (2:00 p.m. AST) – Tropical Depression Eighteen develops from a tropical wave while situated approximately 690 mi (1,110 km) southwest of the Cape Verde Islands.[30]
- 22:00 UTC (5:00 p.m. CDT) – Hurricane Opal makes landfall near Pensacola Beach, Florida with winds of 115 mph (185 km/h).[28]
October 5
- 00:00 UTC (8:00 p.m. AST, October 4) – Tropical Storm Noel re-intensifies into a Category 1 hurricane and again attains its peak intensity with maximum sustained winds of 75 mph (120 km/h) and a minimum barometric pressure of 987 mbar (29.1 inHg).[27]
- 00:00 UTC (7:00 p.m. CDT, October 4) – Hurricane Opal rapidly weakens to a Category 1 hurricane.[28]
- 06:00 UTC (1:00 a.m. CDT) – Hurricane Opal weakens to a tropical storm over southern Alabama.[28]
- 12:00 UTC (7:00 a.m. CDT) – Tropical Storm Opal weakens to a tropical depression over southeastern Tennessee.[28]
- 12:00 UTC (8:00 a.m. AST) – Tropical Depression Eighteen strengthens into Tropical Storm Pablo.[30]
- 18:00 UTC (2:00 p.m. EDT) – Tropical Depression Opal transitions into an extratropical cyclone while located over northeastern Kentucky.[28]
October 6
- 00:00 UTC (8:00 p.m. AST, October 5) – Hurricane Noel weakens to a tropical storm about 735 miles (1,183 km) southwest of the Azores.[27]
- 06:00 UTC (2:00 a.m. AST) – Tropical Storm Pablo attains its peak intensity with maximum sustained winds of 60 mph (95 km/h) and a minimum barometric pressure of 994 mbar (29.4 inHg) while located roughly 1,250 miles (2,010 km) east of the Lesser Antilles.[30]
October 7
- 06:00 UTC (2:00 a.m. AST) – Tropical Storm Noel transitions into an extratropical cyclone while located about 340 miles (550 km) southwest of Pico Island, Azores, and is later absorbed into a cold front.[27]
- 18:00 UTC (2:00 p.m. AST) – Tropical Depression Nineteen develops from a tropical wave while located just east of the Caribbean coast Nicaragua near the Miskito Cays.[31]
October 8
- 12:00 UTC (8:00 a.m. AST) – Tropical Storm Pablo weakens to a tropical depression.[30]
- 18:00 UTC (2:00 p.m. AST) – Tropical Depression Pablo dissipates while located 155 miles (249 km) east-southeast of Barbados.[30]
October 9
- 00:00 UTC (8:00 p.m. EDT, October 8) – Tropical Depression Nineteen intensifies into Tropical Storm Roxanne.[31]

October 10
- 06:00 UTC (2:00 a.m. EDT) – Tropical Storm Roxanne intensifies into a Category 1 hurricane[31] about 230 miles (370 km) east-southeast of Cozumel, Quintana Roo.[32]
- 18:00 UTC (2:00 p.m. EDT) – Hurricane Roxanne intensifies into a Category 2 hurricane.[31]
- 22:00 UTC (6:00 p.m. EDT) – Hurricane Roxanne intensifies into a Category 3 hurricane just southeast of Cozumel while simultaneously attaining its peak intensity with winds of 115 miles per hour (185 km/h) and a minimum barometric pressure of 956 mbar (28.2 inHg).[31]
October 11
- 02:00 UTC (9:00 p.m. CDT, October 10) – Hurricane Roxanne makes landfall near Tulum, Quintana Roo with winds of 115 mph (185 km/h).[31]
- 06:00 UTC (1:00 a.m. CDT) – Hurricane Roxanne weakens to a Category 2 hurricane over the Yucatán Peninsula of Mexico.[31]
- 12:00 UTC (7:00 a.m. CDT) – Hurricane Roxanne weakens to a Category 1 hurricane over land.[31]
October 12
- 12:00 UTC (7:00 a.m. CDT) – Hurricane Roxanne weakens to a tropical storm as it emerges into the Bay of Campeche.[31]
October 14
- 12:00 UTC (7:00 a.m. CDT) – Tropical Storm Roxanne re-intensifies into a Category 1 hurricane in the Bay of Campeche.[31]
October 17
- 06:00 UTC (1:00 a.m. CDT) – Hurricane Roxanne weakens to a tropical storm[31] while located about 175 miles (282 km) north-northeast of Ciudad del Carmen, Campeche.[33]
October 19
- 00:00 UTC (7:00 p.m. CDT, October 18) – Tropical Storm Roxanne weakens to a tropical depression[31] 165 miles (266 km) east of Tampico, Tamaulipas.[34]
October 20
- 12:00 UTC (8:00 a.m. AST) – Tropical Depression Twenty develops from a tropical wave while located about 380 mi (610 km) east-northeast of Barbados.[35]
October 21
- 00:00 UTC (7:00 p.m. CDT, October 20) – Tropical Depression Roxanne dissipates while moving southwestward toward Veracruz.[31]
- 00:00 UTC (8:00 p.m. AST October 20) – Tropical Depression Twenty strengthens into Tropical Storm Sebastien.[35]
October 22
- 18:00 UTC (2:00 p.m. AST) – Tropical Storm Sebastien attains its peak intensity while located about 400 miles (640 km) northeast of the northern Leeward Islands with maximum sustained winds of 65 mph (100 km/h) and a minimum barometric pressure of 1,001 mbar (29.6 inHg).[35]
October 24
- 00:00 UTC (8:00 p.m. AST, October 23) – Tropical Storm Sebastien weakens to a tropical depression.[35]
- 07:00 UTC (3:00 a.m. AST) – Tropical Depression Sebastien makes landfall on Anguilla with winds of 35 mph (55 km/h).[35]
October 25
- 00:00 UTC (8:00 p.m. AST, October 24) – Tropical Depression Sebastien dissipates near Saint Croix, U.S. Virgin Islands.[35]
October 27
- 00:00 UTC (8:00 p.m. AST, October 26) – Tropical Depression Twenty-one develops from a tropical wave while located about 500 mi (800 km) northeast of Anguilla.[36]
- 12:00 UTC (8:00 a.m. AST) – Tropical Depression Twenty-One strengthens into Tropical Storm Tanya.[36]

October 29
- 12:00 UTC (8:00 a.m. AST) – Tropical Storm Tanya strengthens into a Category 1 hurricane.[36]
October 31
- 06:00 UTC (2:00 a.m. AST) – Hurricane Tanya attains its peak intensity with maximum sustained winds of 85 mph (140 km/h) and a minimum barometric pressure of 972 mbar (28.7 inHg).[36]
November[edit]
November 1
- 12:00 UTC (8:00 a.m. AST) – Hurricane Tanya weakens to a tropical storm.[36]
November 2
- 00:00 UTC (8:00 p.m. AST, November 1) – Tropical Storm Tanya transitions into an extratropical cyclone while located just northwest of Graciosa Island, Azores and is subsequently absorbed into a larger low pressure system.[36]
November 30
- The 1995 Atlantic hurricane season officially ends.[3]
See also[edit]
Notes[edit]
- ^ An average Atlantic hurricane season, as defined by the National Oceanic and Atmospheric Administration, has 12 tropical storms, six hurricanes and two major hurricanes.[2]
- ^ Hurricanes reaching Category 3 (111 miles per hour (179 km/h)) and higher on the 5-level Saffir–Simpson wind speed scale are considered major hurricanes.[5]
- ^ The figures for maximum sustained winds and position estimates are rounded to the nearest 5 units (knots, miles, or kilometers), following the convention used in the National Hurricane Center's operational products for each storm. All other units are rounded to the nearest digit.
References[edit]
- ^ Landsea, Christopher W.; Bell, Gerald D.; Gray, William M.; Goldenberg, Stanley B. (May 1998). "The Extremely Active 1995 Atlantic Hurricane Season: Environmental Conditions and Verification of Seasonal Forecasts". Monthly Weather Review. 126 (5). American Meteorological Society: 1174. Bibcode:1998MWRv..126.1174L. doi:10.1175/1520-0493(1998)126<1174:TEAAHS>2.0.CO;2. Retrieved August 22, 2020.
- ^ "Background Information: North Atlantic Hurricane Season". College Park, Maryland: NOAA Climate Prediction Center. Retrieved August 6, 2020.
- ^ a b c Dorst, Neal (June 1, 2018). "Hurricane Season Information". Frequently Asked Questions About Hurricanes. Miami, Florida: NOAA Atlantic Oceanographic and Meteorological Laboratory. Retrieved August 6, 2020.
- ^ a b Pasch, Richard J.; Avila, Lixion A.; Jiann-Gwo, Jiing (May 1998). "Atlantic Tropical Systems of 1994 and 1995: A Comparison of a Quiet Season to a Near-Record-Breaking One". Monthly Weather Review. 126 (5). American Meteorological Society: 1107. Bibcode:1998MWRv..126.1106P. doi:10.1175/1520-0493(1998)126<1106:ATSOAA>2.0.CO;2.
- ^ "Saffir-Simpson Hurricane Wind Scale". Miami, Florida: National Hurricane Center. Retrieved August 6, 2020.
- ^ "Hurricane Marilyn Caribbean 1995". Gaithersburg, Maryland: National Institute of Standards and Technology. April 10, 2017 [May 31, 2011]. Retrieved August 22, 2020.
- ^ "Deaths Associated with Hurricanes Marilyn and Opal—United States, September-October 1995". Morbidity and Mortality Weekly Report. Atlanta, Georgia: Centers for Disease Control and Prevention. January 19, 1996. Retrieved August 22, 2020.
- ^ Fineman, Mark (October 17, 1995). "Roxanne Sinks Barge Off Mexico, Killing at Least 3 : Hurricane: Tugboats rescue 219 of the 244 aboard the craft as the storm slams ashore for the second time in a week. An American oil worker is among the dead". Los Angeles Times. Retrieved August 22, 2020.
- ^ "Tropical Cyclone Naming History and Retired Names". miami, Florida: NOAA National Hurricane Center. Retrieved August 6, 2020.
- ^ "Understanding the Date/Time Stamps". Miami, Florida: NOAA National Hurricane Center. Retrieved August 6, 2020.
- ^ a b c d e f g h Pasch, Richard J. (January 29, 1996). Preliminary Report: Hurricane Allison (PDF) (Report). Miami, Florida: National Hurricane Center. Retrieved August 17, 2020.
- ^ a b c d e f g Mayfield, Max (November 19, 1995). Preliminary Report: Tropical Storm Barry (PDF) (Report). Miami, Florida: National Hurricane Center. Retrieved August 17, 2020.
- ^ a b c d Lawrence, Miles B. (November 17, 1995). Preliminary Report: Tropical Storm Chantal (PDF) (Report). Miami, Florida: National Hurricane Center. Retrieved August 17, 2020.
- ^ a b c d e Avila, Lixion A. (November 14, 1995). Preliminary Report: Tropical Storm Dean (PDF) (Report). Miami, Florida: National Hurricane Center. Retrieved August 17, 2020.
- ^ a b c d e f g h i j k Rappaport, Edward N. (November 26, 1995). Preliminary Report: Hurricane Erin (PDF) (Report). Miami, Florida: National Hurricane Center. Retrieved August 17, 2020.
- ^ a b c d Pasch, Richard J. (January 10, 1996). Brief Information about Tropical Depression Six (PDF) (Report). Miami, Florida: National Hurricane Center. Retrieved August 17, 2020.
- ^ a b c d e f g h i j k l Mayfield, Max; Beven, Jack (November 19, 1995). Preliminary Report: Hurricane Felix (PDF) (Report). Miami, Florida: National Hurricane Center. Retrieved August 17, 2020.
- ^ a b c d Lawrence, Miles B. (December 1, 1995). Preliminary Report: Tropical Storm Gabrielle (PDF) (Report). Miami, Florida: National Hurricane Center. Retrieved August 17, 2020.
- ^ a b c d e f g Avila, Lixion A. (November 15, 1995). Preliminary Report: Hurricane Humberto (PDF) (Report). Miami, Florida: National Hurricane Center. Retrieved August 20, 2020.
- ^ a b c d e f g h i j k l m n Rappaport, Edward N. (November 26, 1995) [Update November 2, 2000]. Preliminary Report: Hurricane Iris (PDF) (Report). Miami, Florida: National Hurricane Center. Retrieved August 20, 2020.
- ^ a b c d e Pasch, Richard J. (January 31, 1996). Preliminary Report: Tropical Storm Jerry (PDF) (Report). Miami, Florida: National Hurricane Center. Retrieved August 20, 2020.
- ^ a b c d e Mayfield, Max (November 19, 1995). Preliminary Report: Tropical Storm Karen (PDF) (Report). Miami, Florida: National Hurricane Center. Retrieved August 20, 2020.
- ^ a b c d e f g h i j k l m n o Lawrence, Miles B. (January 8, 1996) [Updated May 6, 1996]. Preliminary Report: Hurricane Luis (PDF) (Report). Miami, Florida: National Hurricane Center. Retrieved August 20, 2020.
- ^ Avila, Lixion A. (November 24, 1995). Preliminary Report: Tropical Depression Fourteen (PDF) (Report). Miami, Florida: National Hurricane Center. Retrieved August 20, 2020.
- ^ a b c d e f g h i j k l m n o Rappaport, Edward N. (January 17, 1996). Preliminary Report: Hurricane Marilyn (PDF) (Report). Miami, Florida: National Hurricane Center. Retrieved August 20, 2020.
- ^ Rappaport, Edward N. (September 16, 1995). Hurricane Marilyn Advisory Number 19 (Report). Miami, Florida: National Weather Service. Retrieved August 20, 2020.
- ^ a b c d e f g Pasch, Richard J. (February 1, 1996). Preliminary Report: Hurricane Noel (PDF) (Report). Miami, Florida: National Hurricane Center. Retrieved August 20, 2020.
- ^ a b c d e f g h i j k l Mayfield, Max (November 29, 1995) [Updated September 9, 2014]. Preliminary Report: Hurricane Opal (PDF) (Report). Miami, Florida: National Hurricane Center. Retrieved August 20, 2020.
- ^ Pasch, Richard J. (October 2, 1995). Hurricane Opal Intermediate Advisory Number 19A (Report). Miami, Florida: National Weather Service. Retrieved August 20, 2020.
- ^ a b c d e Lawrence, Miles B. (December 4, 1995). Preliminary Report: Tropical Storm Pablo (PDF) (Report). Miami, Florida: National Hurricane Center. Retrieved August 20, 2020.
- ^ a b c d e f g h i j k l m Avila, Lixion A. (November 29, 1995). Preliminary Report: Hurricane Roxanne (PDF) (Report). Miami, Florida: National Hurricane Center. Retrieved August 22, 2020.
- ^ Pasch, Richard J. (October 9, 1995). Tropical Storm Roxanne Intermediate Advisory Number 5A (Report). Miami, Florida: National Weather Service. Retrieved August 22, 2020.
- ^ Lawrence, Miles B. (October 17, 1995). Tropical Storm Roxanne Intermediate Advisory Number 34A (Report). Miami, Florida: National Weather Service. Retrieved August 22, 2020.
- ^ Mayfield, Max (October 18, 1995). Tropical Storm Roxanne Intermediate Advisory Number 41A (Report). Miami, Florida: National Weather Service. Retrieved August 22, 2020.
- ^ a b c d e f Rappaport, Edward N. (December 4, 1995). Preliminary Report: Tropical Storm Sebastien (PDF) (Report). Miami, Florida: National Hurricane Center. Retrieved August 22, 2020.
- ^ a b c d e f Pasch, Richard J. (February 1, 1996). Preliminary Report: Hurricane Tanya (PDF) (Report). Miami, Florida: National Hurricane Center. Retrieved August 22, 2020.
Further reading[edit]
- Lawrence, Miles B.; Mayfield, Max; Avila, Lixion A.; Pasch, Richard J.; Rappaport, Edward N. (May 1998). "Atlantic Hurricane Season of 1995". Monthly Weather Review. 126 (5). American Meteorological Society: 1124–1151. Bibcode:1998MWRv..126.1124L. doi:10.1175/1520-0493(1998)126<1124:AHSO>2.0.CO;2.