From Wikipedia, the free encyclopedia
Ongoing yes / no[edit]
Show last election[edit]
No current seats[edit]
First election[edit]
Default[edit]
Side by side comparison| {{Infobox legislative election}} | {{Infobox legislative election/sandbox}} |
|---|
British general election, 2015|
|
|
This lists parties that won seats. See the complete results below.  Colours denote the winning party, as shown in the main table of results |
| |
British general election, 2015|
|
|
This lists parties that won seats. See the complete results below. Colours denote the winning party, as shown in the main table of results |
| |
Ongoing (first)[edit]
Finished[edit]
Side by side comparison| {{Infobox legislative election}} | {{Infobox legislative election/sandbox}} |
|---|
British general election, 2015|
|
|
This lists parties that won seats. See the complete results below.  Colours denote the winning party, as shown in the main table of results |
| |
British general election, 2015|
|
|
This lists parties that won seats. See the complete results below. Colours denote the winning party, as shown in the main table of results |
| |
Finished (first)[edit]
Side by side comparison| {{Infobox legislative election}} | {{Infobox legislative election/sandbox}} |
|---|
British general election, 2015|
|
| Turnout | ? |
|---|
|
This lists parties that won seats. See the complete results below. Colours denote the winning party, as shown in the main table of results |
| |
British general election, 2015|
|
| Turnout | ? |
|---|
|
This lists parties that won seats. See the complete results below. Colours denote the winning party, as shown in the main table of results |
| |
Custom party colour[edit]
No leader or percentage[edit]
Embedding[edit]
Side by side comparison| {{Infobox legislative election}} | {{Infobox legislative election/sandbox}} |
|---|
British general election, 2015|
|
House of Commons | |
This lists parties that won seats. See the complete results below. | House of Lords | |
This lists parties that won seats. See the complete results below. | |
| |
| |
British general election, 2015|
|
House of Commons | |
This lists parties that won seats. See the complete results below. | House of Lords | |
This lists parties that won seats. See the complete results below. | |
| |
| |
Embedded in infobox election[edit]
Side by side comparison| {{Infobox legislative election}} | {{Infobox legislative election/sandbox}} |
|---|
2018 Mexican general election|
|
|
| Presidential election | |
| Turnout | 63.43% ( 0.35%) 0.35%) |
|---|
|
|
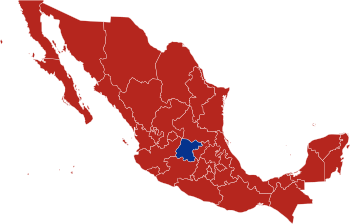 States won by López Obrador in red, Anaya in blue. |
| Senate | |
|
This lists parties that won seats. See the complete results below. | Chamber of Deputies | |
|
This lists parties that won seats. See the complete results below. | |
| |
| |
| |
2018 Mexican general election|
|
|
| Presidential election | |
| Turnout | 63.43% ( 0.35%) |
|---|
|
|
States won by López Obrador in red, Anaya in blue. |
| Senate | |
|
This lists parties that won seats. See the complete results below. | Chamber of Deputies | |
|
This lists parties that won seats. See the complete results below. | |
| |
| |
| |
Linking issue[edit]


.jpg)
.jpg)
_(cropped).jpg)
.jpg)

