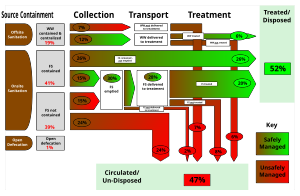
Shit flow diagram
| Shit flow diagram | |
|---|---|
| Synonym | Excreta flow diagram, SFD |
 | |
| An example shit flow diagram | |
| Position in sanitation chain | Planning |
| Application level | City |
| Environmental concerns | Water pollution, environmental health, public health, sewage sludge disposal issues |
A shit flow diagram (also called excreta flow diagram or SFD) is a high level technical drawing used to display how excreta moves through a location, and functions as a tool to identify where improvements are needed.[1] The diagram has a particular focus on treatment of the waste, and its final disposal or use. SFDs are most often used in developing countries.
Development[edit]
In 2012–2013, the World Bank's Water and Sanitation Program sponsored a study on the fecal sludge management of twelve cities with the goal of developing tools for better understanding the flow of excreta through the cities. As a result, Isabel Blackett, Peter Hawkins, and Christiaan Heymans authored The missing link in sanitation service delivery: a review of fecal sludge management in 12 cities.[1] Using this as a basis, a group of excreta management institutions began collaborating in June 2014 to continue development of SFDs.[2]
In November 2014, the SFD Promotion Initiative was started with funding from the Bill & Melinda Gates Foundation. Initially funded as a one year project, it was extended in 2015. In September 2019, the focus of the program shifted to scaling up the current methods of producing SFDs to allow for citywide sanitation in South Asia and Africa. As of 2021 more than 240 shit flow diagram reports have been published. The initiative is managed as part of the Sustainable Sanitation Alliance and is supported by the Bill and Melinda Gates Foundation. It is partnered with many nonprofit organizations such as the Centre for Science and Environment, EAWAG, and the Global Water Security & Sanitation Partnership.[2][3][4][5]
Use in developing countries[edit]
The great majority of those living in urban areas, especially the poor, use non-sewer sanitation systems. This poses environmental and health challenges for growing urban areas in developing countries, and many of these countries will need to change their sanitation strategies as their population grows. Using a shit flow diagram allows political leaders and members of the community to see at a glance the challenges facing their sanitation systems, and where improvements will be most effective. The simplified nature of the diagram allows for easier dialog about local excreta management. Over 140 cities in the developing world have had SFDs prepared and published, many by nonprofit organizations. They are then used to identify where resources should be focused.[6][5][1][2]
So we go and we look around the world at what we call a shit-flow diagram to see where in a city is the sewage going? Is it being processed? Is it getting in the river?
— Bill Gates, [7]
References[edit]
- ^ a b c Blackett, Isabel; Hawkins, Peter; Heymans, Christiaan (April 1, 2014). "The missing link in sanitation service delivery : a review of fecal sludge management in 12 cities". World Bank.
- ^ a b c "The Story Behind the SFDs". sfd.susana.org. Archived from the original on February 1, 2022.
- ^ "SFD Promotion Initiative". www.cseindia.org. Archived from the original on December 10, 2022.
- ^ "SFD – Shit Flow Diagrams – Eawag". www.eawag.ch. Archived from the original on August 4, 2021.
- ^ a b Schroeder, Enno. "Shit flow diagrams (SFD) – Sustainable Sanitation Alliance (SuSanA)". www.susana.org. Archived from the original on December 11, 2022.
- ^ Peal, Andy; Evans, Barbara; Ahilan, Sangaralingam; Ban, Radu; Blackett, Isabel; Hawkins, Peter; Schoebitz, Lars; Scott, Rebecca; Sleigh, Andy; Strande, Linda; Veses, Oscar (January 31, 2020). "Estimating Safely Managed Sanitation in Urban Areas; Lessons Learned From a Global Implementation of Excreta-Flow Diagrams". Frontiers in Environmental Science. 8: 1. doi:10.3389/fenvs.2020.00001. hdl:10871/40296.
- ^ Patel, Nilay (February 12, 2019). "Bill Gates on better health data and better toilets". The Verge. Archived from the original on October 1, 2022.

