
Nottinghamshire County Council elections
Nottinghamshire County Council elections are held every four years. Nottinghamshire County Council is the upper-tier authority for the non-metropolitan county of Nottinghamshire in England. Since the last boundary changes in 2017, 66 county councillors have been elected from 56 electoral divisions.[1]
Council elections[edit]
- 1973 Nottinghamshire County Council election
- 1977 Nottinghamshire County Council election
- 1981 Nottinghamshire County Council election
- 1985 Nottinghamshire County Council election
- 1989 Nottinghamshire County Council election
- 1993 Nottinghamshire County Council election
- 1997 Nottinghamshire County Council election
- 2001 Nottinghamshire County Council election
- 2005 Nottinghamshire County Council election (boundary changes increased the number of seats by 4)[2]
- 2009 Nottinghamshire County Council election
- 2013 Nottinghamshire County Council election
- 2017 Nottinghamshire County Council election
- 2021 Nottinghamshire County Council election
County result maps[edit]
-
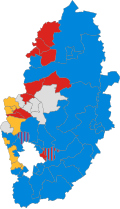
 2021 results map
 -
 2017 results map
 -
 2013 results map
 -
 2009 results map
 -
 2005 results map
 -
 2001 results map
 -
 1997 results map
 -
 1993 results map
 -
 1989 results map
 -
 1985 results map
 -
 1981 results map


By-election results[edit]
1997-2001[edit]
| Party | Candidate | Votes | % | ±% | |
|---|---|---|---|---|---|
| Conservative | 835 | 61.6 | +20.1 | ||
| Labour | 457 | 33.7 | -16.1 | ||
| Liberal Democrats | 64 | 4.7 | -4.0 | ||
| Majority | 378 | 27.9 | |||
| Turnout | 1,356 | ||||
| Conservative gain from Labour | Swing | ||||
| Party | Candidate | Votes | % | ±% | |
|---|---|---|---|---|---|
| Labour | 746 | 71.3 | |||
| Conservative | 301 | 28.7 | |||
| Majority | 445 | 42.6 | |||
| Turnout | 1,047 | 14.8 | |||
| Labour hold | Swing | ||||
2001-2005[edit]
| Party | Candidate | Votes | % | ±% | |
|---|---|---|---|---|---|
| Conservative | 1,895 | 65.2 | +17.3 | ||
| Liberal Democrats | 813 | 28.0 | +0.6 | ||
| Labour | 197 | 6.8 | +0.0 | ||
| Majority | 1,082 | 37.2 | |||
| Turnout | 2,905 | 25.1 | |||
| Conservative hold | Swing | ||||
| Party | Candidate | Votes | % | ±% | |
|---|---|---|---|---|---|
| Conservative | Richard Jackson | 1,488 | 46.5 | +9.1 | |
| Labour | 1,163 | 36.3 | -6.5 | ||
| Liberal Democrats | 552 | 17.2 | +2.2 | ||
| Majority | 325 | 10.2 | |||
| Turnout | 3,203 | 35.8 | |||
| Conservative gain from Labour | Swing | ||||
2005-2009[edit]
| Party | Candidate | Votes | % | ±% | |
|---|---|---|---|---|---|
| Labour | Helen Holt | 1,228 | 38.0 | +3.5 | |
| Conservative | Ken Rees | 628 | 19.4 | +1.0 | |
| Independent | Syd Owen | 620 | 19.2 | +2.0 | |
| Liberal Democrats | Phillip Smith | 544 | 16.8 | -0.3 | |
| Green | Paul Frost | 214 | 6.6 | -2.2 | |
| Majority | 600 | 18.6 | |||
| Turnout | 3,234 | 17.5 | |||
| Labour hold | Swing | ||||
| Party | Candidate | Votes | % | ±% | |
|---|---|---|---|---|---|
| Conservative | Michael Murphy | 1,597 | 32.5 | +0.3 | |
| Labour | John Wilmott | 1,554 | 31.6 | -18.2 | |
| Liberal Democrats | Harry Toseland | 1,007 | 20.5 | +20.5 | |
| UKIP | Peter Foulkes | 413 | 8.4 | +8.4 | |
| Green | Mark Harrison | 350 | 7.1 | -4.5 | |
| Majority | 43 | 0.9 | |||
| Turnout | 4,921 | 21.2 | |||
| Conservative gain from Labour | Swing | ||||
| Party | Candidate | Votes | % | ±% | |
|---|---|---|---|---|---|
| Liberal Democrats | Jason Zadrozny | 1,979 | 73.1 | +59.2 | |
| Labour | David Parker | 435 | 16.1 | -28.7 | |
| Conservative | Peter Thorpe | 222 | 8.2 | -15.6 | |
| UKIP | Peter Foulkes | 70 | 2.6 | +2.6 | |
| Majority | 1,544 | 57.0 | |||
| Turnout | 2,706 | 31.6 | |||
| Liberal Democrats gain from Labour | Swing | ||||
| Party | Candidate | Votes | % | ±% | |
|---|---|---|---|---|---|
| Conservative | Stuart Wallace | 517 | 45.2 | -6.4 | |
| Liberal Democrats | Chris Harrison | 322 | 28.1 | -2.3 | |
| Labour | Glenn Bardill | 198 | 17.3 | -0.7 | |
| UKIP | Terry Coleman | 107 | 9.4 | +9.4 | |
| Majority | 195 | 17.1 | |||
| Turnout | 1,144 | 15.6 | |||
| Conservative hold | Swing | ||||
| Party | Candidate | Votes | % | ±% | |
|---|---|---|---|---|---|
| Labour | Chris Winterton | 1,342 | 33.5 | +13.4 | |
| Mansfield Independent Forum | Andrew Tristram | 1,108 | 27.6 | -12.7 | |
| Conservative | Drew Stafford | 774 | 19.3 | -9.2 | |
| UKIP | Nick Bennet | 489 | 12.2 | +12.2 | |
| Liberal Democrats | Danielle Gent | 295 | 7.4 | -3.8 | |
| Majority | 234 | 5.9 | |||
| Turnout | 4,008 | 20.9 | |||
| Labour gain from Independent | Swing | ||||
2009-2013[edit]
| Party | Candidate | Votes | % | ±% | |
|---|---|---|---|---|---|
| Conservative | John Doddy | 1,958 | 47.7 | +5.9 | |
| Liberal Democrats | David Watts | 1,375 | 33.5 | +20.6 | |
| UKIP | Lee Waters | 682 | 16.6 | +7.0 | |
| Majority | 583 | 14.2 | |||
| Turnout | 4,102 | 25.6 | |||
| Conservative hold | Swing | ||||
| Party | Candidate | Votes | % | ±% | |
|---|---|---|---|---|---|
| Labour | John Peck | 1,557 | 58.0 | +27.8 | |
| Conservative | Daniel Mottishaw | 660 | 24.6 | -9.7 | |
| Nottinghamshire Independents | Jim Gregson | 346 | 12.9 | -22.7 | |
| UKIP | Carole Terzza | 123 | 4.6 | +4.6 | |
| Majority | 897 | 33.4 | |||
| Turnout | 2,686 | 24.52 | |||
| Labour gain from Nottinghamshire Independents | Swing | ||||
2013-2017[edit]
| Party | Candidate | Votes | % | ±% | |
|---|---|---|---|---|---|
| Conservative | Francis Purdue-Horan | 1,270 | 44.0 | +2.2 | |
| Independent | Tracey Kerry | 1,232 | 42.7 | N/A | |
| Labour | Alan Walker | 382 | 13.2 | -7.0 | |
| Majority | 38 | 1.3 | |||
| Turnout | 2,890 | 28.1 | |||
| Conservative hold | Swing | ||||
2021-2025[edit]
| Party | Candidate | Votes | % | ±% | |
|---|---|---|---|---|---|
| Independent | Debbie Darby | 2,009 | 63.8 | +63.8 | |
| Conservative | Jack Kellas | 898 | 28.5 | -11.7 | |
| Labour | Jennifer Kaye | 244 | 7.7 | +7.7 | |
| Majority | 1,111 | 35.3 | |||
| Turnout | 2,890 | ||||
| Independent hold | Swing | ||||
| Party | Candidate | Votes | % | ±% | |
|---|---|---|---|---|---|
| Independent | Kane Oliver | 1,223 | 43.1 | +43.1 | |
| Labour | Milan Radulovic | 1,182 | 41.7 | -0.1 | |
| Conservative | Mick Brown | 431 | 15.2 | -31.2 | |
| Majority | 41 | 1.4 | |||
| Turnout | 2,836 | ||||
| Independent gain from Conservative | Swing | ||||
| Party | Candidate | Votes | % | ±% | |
|---|---|---|---|---|---|
| Ashfield Ind. | Rachel Madden | 1,680 | 51.2 | -7.0 | |
| Labour | Lorraine Fagan | 1,017 | 31.0 | +8.5 | |
| Conservative | Sam Howlett | 584 | 17.8 | -1.5 | |
| Majority | 663 | 20.2 | |||
| Turnout | 3,281 | ||||
| Ashfield Ind. hold | Swing | ||||
References[edit]
- ^ "The Nottinghamshire (Electoral Changes) Order 2016", legislation.gov.uk, The National Archives, SI 2016/659, retrieved 19 August 2022
- ^ "Local election results: Nottinghamshire". BBC News Online. Retrieved 25 September 2009.
- ^ "East Mansfield by-election 2006". Nottinghamshire County Council. Retrieved 25 September 2009.
- ^ "Hucknall by-election 2007". Nottinghamshire County Council. Retrieved 25 September 2009.
- ^ "Sutton-in-Ashfield North By-election 2007". Nottinghamshire County Council. Retrieved 25 September 2009.
- ^ "Newark East by-election result". Nottinghamshire County Council. 18 September 2009. Retrieved 25 September 2009.
- ^ "Mansfield South by-election result". Nottinghamshire County Council. 26 February 2010. Retrieved 26 February 2010.
- ^ "DECLARATION OF RESULT OF POLL" (PDF). 4 August 2016. Retrieved 18 August 2023.
- ^ "Local Elections Archive Project — Collingham Division". www.andrewteale.me.uk. Retrieved 23 May 2022.
- ^ "Local Elections Archive Project — Eastwood Division". www.andrewteale.me.uk. Retrieved 23 May 2022.
- ^ "Local Elections Archive Project — Kirkby South Division". www.andrewteale.me.uk. Retrieved 23 May 2022.