
Herbetswil
Herbetswil | |
|---|---|
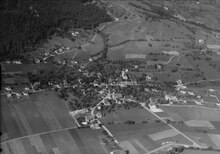
 Herbetswil village | |
 Coat of arms | |
Location of Herbetswil  | |
 Herbetswil  Herbetswil | |
| Coordinates: 47°18′N 7°36′E / 47.300°N 7.600°E | |
| Country | Switzerland |
| Canton | Solothurn |
| District | Thal |
| Area | |
| • Total | 16.35 km2 (6.31 sq mi) |
| Elevation | 524 m (1,719 ft) |
| Population (31 December 2018)[2] | |
| • Total | 539 |
| • Density | 33/km2 (85/sq mi) |
| Time zone | UTC+01:00 (Central European Time) |
| • Summer (DST) | UTC+02:00 (Central European Summer Time) |
| Postal code(s) | 4715 |
| SFOS number | 2424 |
| ISO 3166 code | CH-SO |
| Surrounded by | Aedermannsdorf, Balm bei Günsberg, Farnern (BE), Gänsbrunnen, Günsberg, Rumisberg (BE), Seehof (BE), Welschenrohr |
| Website | herbetswil SFSO statistics |
Herbetswil is a municipality in the district of Thal in the canton of Solothurn in Switzerland.
History[edit]
Herbetswil is first mentioned in 1400 as Hebrechtzwilre.[3]
Geography[edit]

Herbetswil has an area, as of 2009[update], of 16.31 square kilometers (6.30 sq mi). Of this area, 5.67 km2 (2.19 sq mi) or 34.8% is used for agricultural purposes, while 10.1 km2 (3.9 sq mi) or 61.9% is forested. Of the rest of the land, 0.56 km2 (0.22 sq mi) or 3.4% is settled (buildings or roads), 0.01 km2 (2.5 acres) or 0.1% is either rivers or lakes and 0.01 km2 (2.5 acres) or 0.1% is unproductive land.[4]
Of the built up area, housing and buildings made up 1.4% and transportation infrastructure made up 1.5%. Out of the forested land, 58.7% of the total land area is heavily forested and 3.2% is covered with orchards or small clusters of trees. Of the agricultural land, 5.0% is used for growing crops and 6.7% is pastures and 22.4% is used for alpine pastures. All the water in the municipality is flowing water.[4]
The municipality is located in the Thal district, in the Dünnern river valley. It consists of the haufendorf village (an irregular, unplanned and quite closely packed village, built around a central square) of Herbetswil and the hamlets of Vorder and Hinter Hammer.
Coat of arms[edit]
The blazon of the municipal coat of arms is Gules an Angle Plate Sable.[5]
Demographics[edit]


Herbetswil has a population (as of December 2020[update]) of 568.[6] As of 2008[update], 5.4% of the population are resident foreign nationals.[7] Over the last 10 years (1999–2009 ) the population has changed at a rate of -8.4%.[8]
Most of the population (as of 2000[update]) speaks German (546 or 96.1%), with Albanian being second most common (5 or 0.9%) and Arabic being third (5 or 0.9%). There are 3 people who speak French.[9]
As of 2008[update], the gender distribution of the population was 52.3% male and 47.7% female. The population was made up of 262 Swiss men (47.0% of the population) and 30 (5.4%) non-Swiss men. There were 245 Swiss women (43.9%) and 21 (3.8%) non-Swiss women.[10] Of the population in the municipality 291 or about 51.2% were born in Herbetswil and lived there in 2000. There were 132 or 23.2% who were born in the same canton, while 102 or 18.0% were born somewhere else in Switzerland, and 39 or 6.9% were born outside of Switzerland.[9]
In 2008[update] there were 4 live births to Swiss citizens and there were 4 deaths of Swiss citizens and 2 non-Swiss citizen deaths. Ignoring immigration and emigration, the population of Swiss citizens remained the same while the foreign population decreased by 2. There was 1 Swiss woman who immigrated back to Switzerland. At the same time, there were 4 non-Swiss men and 1 non-Swiss woman who immigrated from another country to Switzerland. The total Swiss population change in 2008 (from all sources, including moves across municipal borders) was a decrease of 12 and the non-Swiss population increased by 4 people. This represents a population growth rate of -1.5%.[7]
The age distribution, as of 2000[update], in Herbetswil is; 49 children or 8.6% of the population are between 0 and 6 years old and 98 teenagers or 17.3% are between 7 and 19. Of the adult population, 24 people or 4.2% of the population are between 20 and 24 years old. 151 people or 26.6% are between 25 and 44, and 151 people or 26.6% are between 45 and 64. The senior population distribution is 75 people or 13.2% of the population are between 65 and 79 years old and there are 20 people or 3.5% who are over 80.[11]
As of 2000[update], there were 227 people who were single and never married in the municipality. There were 293 married individuals, 31 widows or widowers and 17 individuals who are divorced.[9]
As of 2000[update], there were 221 private households in the municipality, and an average of 2.6 persons per household.[8] There were 55 households that consist of only one person and 23 households with five or more people. Out of a total of 223 households that answered this question, 24.7% were households made up of just one person and there were 8 adults who lived with their parents. Of the rest of the households, there are 63 married couples without children, 86 married couples with children There were 5 single parents with a child or children. There were 4 households that were made up of unrelated people and 2 households that were made up of some sort of institution or another collective housing.[9]
In 2000[update] there were 105 single family homes (or 59.7% of the total) out of a total of 176 inhabited buildings. There were 23 multi-family buildings (13.1%), along with 36 multi-purpose buildings that were mostly used for housing (20.5%) and 12 other use buildings (commercial or industrial) that also had some housing (6.8%). Of the single family homes 18 were built before 1919, while 15 were built between 1990 and 2000.[12]
In 2000[update] there were 246 apartments in the municipality. The most common apartment size was 4 rooms of which there were 68. There were 7 single room apartments and 101 apartments with five or more rooms. Of these apartments, a total of 212 apartments (86.2% of the total) were permanently occupied, while 13 apartments (5.3%) were seasonally occupied and 21 apartments (8.5%) were empty.[12] As of 2009[update], the construction rate of new housing units was 0 new units per 1000 residents.[8] The vacancy rate for the municipality, in 2010[update], was 2.41%.[8]
The historical population is given in the following chart:[3][13]

Politics[edit]
In the 2007 federal election the most popular party was the CVP which received 45.65% of the vote. The next three most popular parties were the SVP (27.97%), the FDP (19.77%) and the Green Party (4.35%). In the federal election, a total of 236 votes were cast, and the voter turnout was 54.6%.[14]
Economy[edit]
As of 2010[update], Herbetswil had an unemployment rate of 1.9%. As of 2008[update], there were 46 people employed in the primary economic sector and about 19 businesses involved in this sector. 80 people were employed in the secondary sector and there were 7 businesses in this sector. 32 people were employed in the tertiary sector, with 11 businesses in this sector.[8] There were 286 residents of the municipality who were employed in some capacity, of which females made up 38.8% of the workforce.
In 2008[update] the total number of full-time equivalent jobs was 124. The number of jobs in the primary sector was 31, all of which were in agriculture. The number of jobs in the secondary sector was 71 of which 64 or (90.1%) were in manufacturing and 7 (9.9%) were in construction. The number of jobs in the tertiary sector was 22. In the tertiary sector; 3 or 13.6% were in wholesale or retail sales or the repair of motor vehicles, 14 or 63.6% were in a hotel or restaurant, 1 was in the information industry, 1 was a technical professional or scientist, 2 or 9.1% were in education.[15]
In 2000[update], there were 80 workers who commuted into the municipality and 190 workers who commuted away. The municipality is a net exporter of workers, with about 2.4 workers leaving the municipality for every one entering.[16] Of the working population, 11.2% used public transportation to get to work, and 56.3% used a private car.[8]
Religion[edit]

From the 2000 census[update], 370 or 65.1% were Roman Catholic, while 131 or 23.1% belonged to the Swiss Reformed Church. Of the rest of the population, there was 1 individual who belongs to the Christian Catholic Church, and there were 11 individuals (or about 1.94% of the population) who belonged to another Christian church. There were 21 (or about 3.70% of the population) who were Islamic. 28 (or about 4.93% of the population) belonged to no church, are agnostic or atheist, and 6 individuals (or about 1.06% of the population) did not answer the question.[9]
Weather[edit]
Herbetswil has an average of 139.9 days of rain or snow per year and on average receives 1,192 mm (46.9 in) of precipitation. The wettest month is June during which time Herbetswil receives an average of 119 mm (4.7 in) of rain or snow. During this month there is precipitation for an average of 13.1 days. The month with the most days of precipitation is May, with an average of 13.7, but with only 109 mm (4.3 in) of rain or snow. The driest month of the year is September with an average of 82 mm (3.2 in) of precipitation over 9 days.[17]
Education[edit]

In Herbetswil about 208 or (36.6%) of the population have completed non-mandatory upper secondary education, and 30 or (5.3%) have completed additional higher education (either university or a Fachhochschule). Of the 30 who completed tertiary schooling, 73.3% were Swiss men, 20.0% were Swiss women.[9]
During the 2010–2011 school year there were a total of 43 students in the Herbetswil school system. The education system in the Canton of Solothurn allows young children to attend two years of non-obligatory Kindergarten.[18] During that school year, there were children in kindergarten. The canton's school system requires students to attend six years of primary school, with some of the children attending smaller, specialized classes. In the municipality there were 43 students in primary school. The secondary school program consists of three lower, obligatory years of schooling, followed by three to five years of optional, advanced schools. All the lower secondary students from Herbetswil attend their school in a neighboring municipality.[19]
As of 2000[update], there were 107 students in Herbetswil who came from another municipality, while 66 residents attended schools outside the municipality.[16]
References[edit]
- ^ a b "Arealstatistik Standard - Gemeinden nach 4 Hauptbereichen". Federal Statistical Office. Retrieved 13 January 2019.
- ^ "Ständige Wohnbevölkerung nach Staatsangehörigkeitskategorie Geschlecht und Gemeinde; Provisorische Jahresergebnisse; 2018". Federal Statistical Office. 9 April 2019. Retrieved 11 April 2019.
- ^ a b Herbetswil in German, French and Italian in the online Historical Dictionary of Switzerland.
- ^ a b Swiss Federal Statistical Office-Land Use Statistics 2009 data (in German) accessed 25 March 2010
- ^ Flags of the World.com accessed 8 April 2011
- ^ "Ständige und nichtständige Wohnbevölkerung nach institutionellen Gliederungen, Geburtsort und Staatsangehörigkeit". bfs.admin.ch (in German). Swiss Federal Statistical Office - STAT-TAB. 31 December 2020. Retrieved 21 September 2021.
- ^ a b Swiss Federal Statistical Office – Superweb database – Gemeinde Statistics 1981-2008 Archived 28 June 2010 at the Wayback Machine (in German) accessed 19 June 2010
- ^ a b c d e f Swiss Federal Statistical Office Archived 5 January 2016 at the Wayback Machine accessed 8 April 2011
- ^ a b c d e f STAT-TAB Datenwürfel für Thema 40.3 – 2000 Archived 9 April 2014 at the Wayback Machine (in German) accessed 2 February 2011
- ^ Canton of Solothurn Statistics – Wohnbevölkerung der Gemeinden nach Nationalität und Geschlecht Archived 5 March 2011 at the Wayback Machine (in German) accessed 11 March 2011
- ^ Canton of Solothurn Statistics – Wohnbevölkerung nach Gemeinden, Nationalität, Altersgruppen und Zivilstand, Total (Männer + Frauen) Archived 7 July 2011 at the Wayback Machine (in German) accessed 11 March 2011
- ^ a b Federal Statistical Office STAT-TAB – Datenwürfel für Thema 09.2 – Gebäude und Wohnungen Archived 21 January 2015 at the Wayback Machine (in German) accessed 28 January 2011
- ^ Swiss Federal Statistical Office STAT-TAB Bevölkerungsentwicklung nach Region, 1850-2000 Archived 30 September 2014 at the Wayback Machine (in German) accessed 29 January 2011
- ^ Swiss Federal Statistical Office, Nationalratswahlen 2007: Stärke der Parteien und Wahlbeteiligung, nach Gemeinden/Bezirk/Canton Archived 14 May 2015 at the Wayback Machine (in German) accessed 28 May 2010
- ^ Swiss Federal Statistical Office STAT-TAB Betriebszählung: Arbeitsstätten nach Gemeinde und NOGA 2008 (Abschnitte), Sektoren 1-3 Archived 25 December 2014 at the Wayback Machine (in German) accessed 28 January 2011
- ^ a b Swiss Federal Statistical Office – Statweb (in German) accessed 24 June 2010
- ^ "Temperature and Precipitation Average Values-Table, 1961-1990" (in German, French, and Italian). Federal Office of Meteorology and Climatology – MeteoSwiss. Archived from the original on 27 June 2009. Retrieved 8 May 2009., the Herbetswil weather station elevation is 524 meters above sea level.
- ^ Canton of Solothurn – Education information Archived 8 May 2011 at the Wayback Machine (in German) accessed 11 March 2011
- ^ Canton of Solothurn – School statistics Archived 7 July 2011 at the Wayback Machine (in German) accessed 13 March 2011
External links[edit]
- Official website
- Herbetswil in German, French and Italian in the online Historical Dictionary of Switzerland.
Municipalities in Thal District, Switzerland | ||
|---|---|---|
| International | |
|---|---|
| National | |
| Other | |