
File:2017-2018 South-West Indian Ocean cyclone season summary.png

Size of this preview: 720 × 600 pixels. Other resolutions: 288 × 240 pixels | 576 × 480 pixels | 922 × 768 pixels | 1,229 × 1,024 pixels | 2,458 × 2,048 pixels | 4,000 × 3,333 pixels.
Original file (4,000 × 3,333 pixels, file size: 2.61 MB, MIME type: image/png)
| This is a file from the Wikimedia Commons. Information from its description page there is shown below. Commons is a freely licensed media file repository. You can help. |
| Description |
English: This map shows the tracks of all tropical cyclones in the 2017-18 South-West Indian Ocean cyclone season. The points show the location of each storm at 6-hour intervals. The colour represents the storm's maximum sustained wind speeds as classified in the Saffir-Simpson Hurricane Scale (see below), and the shape of the data points represent the type of the storm.
Tropical depression (≤38 mph, ≤62 km/h)
Tropical storm (39–73 mph, 63–118 km/h)
Category 1 (74–95 mph, 119–153 km/h)
Category 2 (96–110 mph, 154–177 km/h)
Category 3 (111–129 mph, 178–208 km/h)
Category 4 (130–156 mph, 209–251 km/h)
Category 5 (≥157 mph, ≥252 km/h)
Unknown
Storm type |
| Source | Created using Wikipedia:WikiProject Tropical cyclones/Tracks. The background image is from NASA [1]. The tracking data is from the Joint Typhoon Warning Center's best track database |
| Author | Meow |
| This work has been released into the public domain by its author, Meow. This applies worldwide. In some countries this may not be legally possible; if so: Meow grants anyone the right to use this work for any purpose, without any conditions, unless such conditions are required by law. |
File history
Click on a date/time to view the file as it appeared at that time.
| Date/Time | Thumbnail | Dimensions | User | Comment | |
|---|---|---|---|---|---|
| current | 16:22, 22 January 2020 |  | 4,000 × 3,333 (2.61 MB) | Supportstorm | JTWC/Reunion data |
| 03:50, 23 December 2019 | 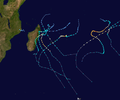 | 4,000 × 3,333 (2.62 MB) | Supportstorm | Best track update, basin dimensions: --xmax 80 --xmin 30 --ymax 0 --ymin -50 | |
| 18:43, 29 April 2019 |  | 3,000 × 1,854 (2.05 MB) | Es204L | Reverted to version as of 03:43, 28 January 2019 (UTC) | |
| 02:05, 4 March 2019 |  | 4,000 × 3,077 (3.84 MB) | Es204L | Reverted to version as of 03:45, 25 April 2018 (UTC) | |
| 03:43, 28 January 2019 |  | 3,000 × 1,854 (2.05 MB) | Es204L | last | |
| 03:45, 25 April 2018 |  | 4,000 × 3,077 (3.84 MB) | Cyclonebiskit | update, +Fakir | |
| 14:01, 19 March 2018 |  | 4,000 × 3,077 (3.78 MB) | Cyclonebiskit | +Eliakim | |
| 13:16, 12 March 2018 |  | 4,000 × 3,077 (3.77 MB) | Cyclonebiskit | +Dumazile | |
| 01:33, 24 February 2018 |  | 4,000 × 3,077 (3.71 MB) | Cyclonebiskit | Smaller dots, denote PT/ET points | |
| 08:23, 10 February 2018 |  | 4,000 × 3,077 (3.09 MB) | Meow | 02-10 00Z |
File usage
The following pages on the English Wikipedia use this file (pages on other projects are not listed):
- 2017–18 South-West Indian Ocean cyclone season
- Cyclone Ava
- Cyclone Berguitta
- Cyclone Dumazile
- Cyclone Fakir
- Tropical Storm Eliakim
- Tropical cyclones in 2018
- User:PurpleLights/Timeline of the 2017–18 South-West Indian Ocean cyclone season
- Wikipedia:WikiProject Tropical cyclones/2018 FT task force
- Wikipedia talk:WikiProject Tropical cyclones/Archive 48
- Template:2017–18 South-West Indian Ocean cyclone season buttons
Global file usage
The following other wikis use this file:
- Usage on es.wikipedia.org
- Usage on fr.wikipedia.org
- Usage on ko.wikipedia.org
- Usage on pt.wikipedia.org
- Usage on zh.wikipedia.org