From Wikipedia, the free encyclopedia
Part of the 1999 Irish local elections
1999 South Dublin County Council election|
|
|
|
|
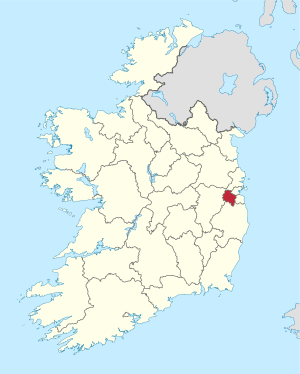 Map showing the area of South Dublin County Council |
|
|
Council control after election
TBD
| |
An election to South Dublin County Council took place on 10 June 1999 as part of that year's Irish local elections. 26 councillors were elected from five local electoral areas for a five-year term of office on the system of proportional representation by means of the single transferable vote (PR-STV).
Results by party[edit]
Results by local electoral area[edit]
Clondalkin[edit]
Clondalkin - 5 seats
| Party |
Candidate |
FPv% |
Count
|
| 1 |
2 |
3 |
4 |
5 |
6 |
7 |
8
|
|
|
Fine Gael
|
Senator Therese Ridge*
|
17.74
|
1,401
|
|
|
|
|
|
|
|
|
|
Fianna Fáil
|
John Curran
|
14.86
|
1,174
|
1,183
|
1,188
|
1,194
|
1,211
|
1,225
|
1,359
|
|
|
|
Progressive Democrats
|
Colm Tyndall*
|
14.85
|
1,173
|
1,195
|
1,198
|
1,214
|
1,254
|
1,275
|
1,350
|
|
|
|
Independent
|
Colm McGrath*
|
12.80
|
1,011
|
1,023
|
1,032
|
1,056
|
1,098
|
1,126
|
1,191
|
1,362
|
|
|
Labour
|
Robert Dowds
|
9.67
|
764
|
778
|
795
|
817
|
881
|
937
|
967
|
1,070
|
|
|
Sinn Féin
|
John McCann
|
7.87
|
622
|
627
|
642
|
664
|
696
|
790
|
801
|
919
|
|
|
Fianna Fáil
|
Liam Lawlor TD
|
6.94
|
611
|
617
|
618
|
628
|
635
|
669
|
721
|
|
|
|
Fianna Fáil
|
Sheila O'Brien
|
4.77
|
377
|
382
|
387
|
394
|
397
|
401
|
|
|
|
|
Workers' Party
|
Mick Finnegan
|
3.38
|
267
|
269
|
277
|
288
|
320
|
|
|
|
|
|
Green
|
Ger Doherty
|
3.08
|
243
|
248
|
260
|
277
|
|
|
|
|
|
|
Independent
|
James O'Connor
|
1.68
|
133
|
135
|
167
|
|
|
|
|
|
|
|
Independent
|
Peter Greene
|
1.56
|
123
|
125
|
|
|
|
|
|
|
| Electorate: 28,256 Valid: 7,899 (27.96%) Spoilt: 99 Quota: 1,317 Turnout: 7,998 (28.31%)
|
Lucan - 4 seats
| Party |
Candidate |
FPv% |
Count
|
| 1 |
2 |
3 |
4 |
5 |
6 |
7
|
|
|
Green
|
Paul Gogarty
|
14.73
|
1,238
|
1,287
|
1,425
|
1,485
|
1,722
|
|
|
|
|
Labour
|
Joanna Tuffy
|
14.59
|
1,226
|
1,284
|
1,411
|
1,485
|
1,917
|
|
|
|
|
Independent
|
Guss O'Connell*
|
14.36
|
1,207
|
1,224
|
1,285
|
1,328
|
1,412
|
1,473
|
1,483
|
|
|
Independent
|
Derek Keating
|
13.24
|
1,113
|
1,138
|
1,216
|
1,264
|
1,427
|
1,531
|
1,563
|
|
|
Fine Gael
|
Peter Brady*
|
12.49
|
1,050
|
1,098
|
1,161
|
1,261
|
|
|
|
|
|
Fianna Fáil
|
Deirdre Doherty-Ryan
|
11.45
|
962
|
1,000
|
1,019
|
1,472
|
1,652
|
1,723
|
|
|
|
Fianna Fáil
|
Finbarr Hanrahan*
|
9.25
|
777
|
805
|
829
|
|
|
|
|
|
|
Workers' Party
|
Anne Finnegan
|
6.41
|
539
|
557
|
|
|
|
|
|
|
|
Progressive Democrats
|
Rose Dunne
|
3.47
|
292
|
|
|
|
|
|
|
| Electorate: 26,303 Valid: 8,404 (31.95%) Spoilt: 83 Quota: 1,681 Turnout: 8,487 (32.27%)
|
Tallaght Central[edit]
Tallaght Central - 5 seats
| Party |
Candidate |
FPv% |
Count
|
| 1 |
2 |
3 |
4 |
5 |
6 |
7 |
8 |
9 |
10
|
|
|
Fianna Fáil
|
Charlie O'Connor*
|
16.84
|
1,521
|
|
|
|
|
|
|
|
|
|
|
|
Sinn Féin
|
Mark Daly
|
14.34
|
1,295
|
1,308
|
1,360
|
1,404
|
1,440
|
1,501
|
1,504
|
1,506
|
|
|
|
|
Fine Gael
|
Brian Hayes TD*
|
13.01
|
1,175
|
1,179
|
1,230
|
1,464
|
1,549
|
|
|
|
|
|
|
|
Socialist Party
|
Mick Murphy
|
8.34
|
753
|
765
|
803
|
813
|
826
|
876
|
877
|
879
|
928
|
|
|
|
Labour
|
Eamonn Maloney
|
7.92
|
715
|
722
|
743
|
781
|
798
|
891
|
891
|
892
|
1,079
|
1,245
|
|
|
Labour
|
Don Tipping*
|
8.37
|
666
|
674
|
703
|
737
|
793
|
906
|
925
|
927
|
1,129
|
1,406
|
|
|
Labour
|
Denis Mackin
|
6.58
|
594
|
598
|
618
|
625
|
643
|
667
|
671
|
671
|
|
|
|
|
Fianna Fáil
|
Margaret Farrell*
|
5.97
|
539
|
550
|
576
|
596
|
833
|
909
|
925
|
933
|
1,027
|
1,166
|
|
|
Fianna Fáil
|
Pat Somers
|
5.28
|
477
|
481
|
488
|
502
|
|
|
|
|
|
|
|
|
Progressive Democrats
|
Joe Neville*
|
5.22
|
471
|
479
|
505
|
534
|
535
|
|
|
|
|
|
|
|
Fine Gael
|
Karen Warren
|
4.65
|
420
|
426
|
451
|
|
|
|
|
|
|
|
|
|
Green
|
Mary Bowers
|
3.37
|
304
|
324
|
|
|
|
|
|
|
|
|
|
|
Independent
|
Ray Kelly
|
1.12
|
101
|
|
|
|
|
|
|
|
|
|
| Electorate: 29,354 Valid: 9,031 (30.77%) Spoilt: 109 Quota: 1,506 Turnout: 9,140 (31.14%)
|
Tallaght Oldbawn[edit]
Tallaght Oldbawn - 5 seats
| Party |
Candidate |
FPv% |
Count
|
| 1 |
2 |
3 |
4 |
5 |
6 |
7 |
8 |
9
|
|
|
Fianna Fáil
|
John Hannon*
|
18.72
|
1,638
|
|
|
|
|
|
|
|
|
|
|
Sinn Féin
|
Seán Crowe
|
17.69
|
1,548
|
|
|
|
|
|
|
|
|
|
|
Labour
|
Mick Billane*
|
13.27
|
1,161
|
1,165
|
1,184
|
1,213
|
1,251
|
1,297
|
1,343
|
1,389
|
1,488
|
|
|
Labour
|
Pat Rabbitte
|
9.91
|
867
|
890
|
904
|
929
|
947
|
1,001
|
1,111
|
1,205
|
1,499
|
|
|
Progressive Democrats
|
Catherine Quinn*
|
9.60
|
840
|
853
|
856
|
877
|
893
|
911
|
959
|
1,028
|
1,139
|
|
|
Fianna Fáil
|
Jim Daly
|
9.24
|
809
|
866
|
877
|
893
|
957
|
1,059
|
1,088
|
1,138
|
1,213
|
|
|
Fine Gael
|
Paul Ringland
|
5.51
|
482
|
497
|
501
|
509
|
516
|
527
|
578
|
786
|
|
|
|
Fine Gael
|
Ian Mitchell
|
5.14
|
450
|
459
|
463
|
474
|
501
|
516
|
536
|
|
|
|
|
Green
|
Patrick Quinn
|
3.55
|
311
|
326
|
336
|
364
|
380
|
396
|
|
|
|
|
|
Fianna Fáil
|
Frank Godfrey
|
2.91
|
255
|
269
|
280
|
307
|
351
|
|
|
|
|
|
|
Fianna Fáil
|
Joe McCormac
|
2.40
|
210
|
237
|
241
|
245
|
|
|
|
|
|
|
|
Independent
|
Marie Hennessy
|
2.07
|
181
|
183
|
192
|
|
|
|
|
|
|
| Electorate: 27,486 Valid: 8,752 (31.84%) Spoilt: 120 Quota: 1,459 Turnout: 8,872 (32.28%)
|
Terenure-Rathfarnam[edit]
Terenure-Rathfarnam - 7 seats
| Party |
Candidate |
FPv% |
Count
|
| 1 |
2 |
3 |
4 |
5 |
6 |
7 |
8 |
9 |
10 |
11 |
12
|
|
|
Fianna Fáil
|
Senator Ann Ormonde*
|
12.16
|
2,463
|
2,469
|
2,496
|
2,581
|
|
|
|
|
|
|
|
|
|
|
Fine Gael
|
Stanley Laing*
|
11.55
|
2,340
|
2,348
|
2,486
|
2,508
|
2,512
|
2,534
|
|
|
|
|
|
|
|
|
Fianna Fáil
|
John Lahart
|
9.77
|
1,978
|
1,985
|
1,988
|
2,011
|
2,024
|
2,048
|
2,160
|
2,209
|
2,314
|
2,339
|
2,423
|
2,615
|
|
|
Progressive Democrats
|
Cáit Keane*
|
9.39
|
1,902
|
1,915
|
1,939
|
1,960
|
1,967
|
1,998
|
2,053
|
2,113
|
2,152
|
2,166
|
2,191
|
2,441
|
|
|
Fianna Fáil
|
Máire Ardagh
|
8.45
|
1,711
|
1,714
|
1,719
|
1,727
|
1,731
|
1,752
|
2,094
|
2,117
|
2,206
|
2,213
|
2,228
|
2,290
|
|
|
Independent
|
Sheila Donnelly
|
8.04
|
1,629
|
1,715
|
1,731
|
1,740
|
1,741
|
1,760
|
1,770
|
1,812
|
1,870
|
2,781
|
|
|
|
|
Labour
|
Éamonn Walsh*
|
7.32
|
1,483
|
1,485
|
1,496
|
1,629
|
1,632
|
1,756
|
1,844
|
2,191
|
2,364
|
2,377
|
2,402
|
2,650
|
|
|
Green
|
Andrew Shorten*
|
5.13
|
1,039
|
1,050
|
1,070
|
1,136
|
1,140
|
1,267
|
1,285
|
1,362
|
1,579
|
1,607
|
1,659
|
1,816
|
|
|
Independent
|
Niall Murray
|
4.74
|
960
|
977
|
985
|
996
|
998
|
1,013
|
1,016
|
1,025
|
1,061
|
|
|
|
|
|
Fine Gael
|
Jane Lehane
|
4.23
|
857
|
860
|
1,062
|
1,093
|
1,097
|
1,107
|
1,118
|
1,192
|
1,214
|
1,236
|
1,284
|
|
|
|
Sinn Féin
|
Una Sloan
|
3.76
|
761
|
761
|
762
|
770
|
772
|
890
|
910
|
938
|
|
|
|
|
|
|
Fianna Fáil
|
Maria Bohan
|
3.30
|
668
|
669
|
670
|
673
|
675
|
698
|
|
|
|
|
|
|
|
|
Socialist Party
|
Lisa Maher
|
3.15
|
638
|
641
|
643
|
653
|
654
|
|
|
|
|
|
|
|
|
|
Labour
|
Paddy Cosgrave
|
2.96
|
600
|
607
|
611
|
723
|
725
|
770
|
778
|
|
|
|
|
|
|
|
Labour
|
Tom Rowan
|
2.76
|
559
|
561
|
582
|
|
|
|
|
|
|
|
|
|
|
|
Fine Gael
|
Honor O'Connor
|
2.43
|
492
|
493
|
|
|
|
|
|
|
|
|
|
|
|
|
Independent
|
Gerard Dolan
|
0.85
|
173
|
|
|
|
|
|
|
|
|
|
|
|
| Electorate: 51,423 Valid: 20,253 (39.39%) Spoilt: 240 Quota: 2,532 Turnout: 20,493 (39.85%)
|
External links[edit]


