
Itingen: Difference between revisions
m robot Adding: lmo:Itingen |
added demographics and geography |
||
| Line 24: | Line 24: | ||
|}} |
|}} |
||
'''Itingen''' is a [[Municipalities of Switzerland|municipality]] in the district of [[Sissach (district)|Sissach]] in the [[Cantons of Switzerland|canton]] of [[Basel-Country]] in [[Switzerland]]. |
'''Itingen''' is a [[Municipalities of Switzerland|municipality]] in the district of [[Sissach (district)|Sissach]] in the [[Cantons of Switzerland|canton]] of [[Basel-Country]] in [[Switzerland]]. |
||
== |
==History== |
||
Itingen is first mentioned in 1226 as ''Utingen''. In 1454 it was mentioned as ''Uetingen''.<ref name=HDS/> |
|||
| ⚫ | |||
==Geography== |
|||
Itingen has an area, {{as of|2009|lc=on}}, of {{km2 to mi2|3.14}}. Of this area, {{km2 to mi2|0.9|abbr=yes}} or 28.7% is used for agricultural purposes, while {{km2 to mi2|1.48|abbr=yes}} or 47.1% is forested. Of the rest of the land, {{km2 to mi2|0.75|abbr=yes}} or 23.9% is settled (buildings or roads) and {{convert|0.01|km2|acre|abbr=on}} or 0.3% is unproductive land.<ref name=BFS_land>[http://www.bfs.admin.ch/bfs/portal/de/index/themen/02/03/blank/data/gemeindedaten.html Swiss Federal Statistical Office-Land Use Statistics] 2009 data {{de icon}} accessed 25 March 2010</ref> |
|||
Of the built up area, industrial buildings made up 3.2% of the total area while housing and buildings made up 9.6% and transportation infrastructure made up 10.5%. Out of the forested land, 43.6% of the total land area is heavily forested and 3.5% is covered with orchards or small clusters of trees. Of the agricultural land, 11.5% is used for growing crops and 13.1% is pastures, while 4.1% is used for orchards or vine crops.<ref name=BFS_land/> |
|||
The municipality is located in the Sissach district, in the mid-Ergolz valley. The old village center is located perpendicular to the old cantonal road and to the left of the [[Basel]]-[[Olten]] rail line. |
|||
==Coat of arms== |
|||
The [[blazon]] of the municipal [[coat of arms]] is ''Gules, a Fish nainaint winged Argent.''<ref>[http://www.crwflags.com/fotw/flags/ch-bl051.html Flags of the World.com] accessed 05-March-2011</ref> |
|||
==Demographics== |
|||
Itingen has a population ({{as of|{{Swiss populations YM|CH-BL}}|lc=on}}) of {{Swiss populations|CH-BL|2849}}.{{Swiss populations ref|CH-BL}} {{as of|2008}}, 15.6% of the population are resident foreign nationals.<ref name=HDS_superweb>[http://www.bfs.admin.ch/bfs/portal/de/index/infothek/onlinedb/superweb/login.html Swiss Federal Statistical Office - Superweb database - Gemeinde Statistics 1981-2008] {{de icon}} accessed 19 June 2010</ref> Over the last 10 years (1997-2007) the population has changed at a rate of 16.5%.<ref name=SFSO>[http://www.bfs.admin.ch/bfs/portal/en/index/regionen/regionalportraets/gemeindesuche.html Swiss Federal Statistical Office] accessed 05-March-2011</ref> |
|||
Most of the population ({{as of|2000|lc=on}}) speaks [[German language|German]] (1,441 or 89.1%), with [[Italian language]] being second most common (60 or 3.7%) and [[Serbo-Croatian]] being third (41 or 2.5%). There are 14 people who speak [[French language|French]] and 2 people who speak [[Romansh language|Romansh]].<ref name=STAT2000/> |
|||
{{as of|2008}}, the gender distribution of the population was 50.5% male and 49.5% female. The population was made up of 1,545 Swiss citizens (82.7% of the population), and 323 non-Swiss residents (17.3%)<ref name=BL_Stat_Age/> Of the population in the municipality 357 or about 22.1% were born in Itingen and lived there in 2000. There were 527 or 32.6% who were born in the same canton, while 448 or 27.7% were born somewhere else in Switzerland, and 262 or 16.2% were born outside of Switzerland.<ref name=STAT2000/> |
|||
In {{as of|2008|alt=2008}} there were 12 live births to Swiss citizens and 1 birth to non-Swiss citizens, and in same time span there were 12 deaths of Swiss citizens and 2 non-Swiss citizen deaths. Ignoring immigration and emigration, the population of Swiss citizens remained the same while the foreign population decreased by 1. There were 2 Swiss men and 2 Swiss women who immigrated back to Switzerland. At the same time, there were 8 non-Swiss men and 1 non-Swiss woman who immigrated from another country to Switzerland. The total Swiss population change in 2008 (from all sources, including moves across municipal borders) was an increase of 28 and the non-Swiss population decreased by 11 people. This represents a [[Population growth#Population growth rate|population growth rate]] of 0.9%.<ref name=HDS_superweb/> |
|||
The age distribution, {{as of|2010|lc=on}}, in Itingen is; 119 children or 6.4% of the population are between 0 and 6 years old and 259 teenagers or 13.9% are between 7 and 19. Of the adult population, 237 people or 12.7% of the population are between 20 and 29 years old. 258 people or 13.8% are between 30 and 39, 301 people or 16.1% are between 40 and 49, and 442 people or 23.7% are between 50 and 64. The senior population distribution is 197 people or 10.5% of the population are between 65 and 79 years old and there are 55 people or 2.9% who are over 80.<ref name=BL_Stat_Age>[http://www.statistik.bl.ch/stabl_data/stabl_bv/index.php?titel_id=5&thema_id=2&unterthema_id=58 Canton of Basel-Land Statistics], ''Wohnbevölkerung nach Nationalität und Konfession per 30. September 2010'' {{de icon}} accessed 16 February 2011</ref> |
|||
{{as of|2000}}, there were 631 people who were single and never married in the municipality. There were 836 married individuals, 79 widows or widowers and 72 individuals who are divorced.<ref name=STAT2000>[http://www.pxweb.bfs.admin.ch/Database/German_40%20-%20Eidgen%C3%B6ssische%20Volksz%C3%A4hlung/40.3%20-%202000/40.3%20-%202000.asp?lang=1&prod=40&secprod=3&openChild=true STAT-TAB Datenwürfel für Thema 40.3 - 2000] {{de icon}} accessed 2 February 2011 </ref> |
|||
{{as of|2000}} the average number of residents per living room was 0.54 which is about equal to the cantonal average of 0.56 per room. In this case, a room is defined as space of a housing unit of at least {{m2 to ft2|4|abbr=yes|precision=-1}} as normal bedrooms, dining rooms, living rooms, kitchens and habitable cellars and attics.<ref>{{cite manual | author = Eurostat| title = Urban Audit Glossary| section = Housing (SA1)| version = 2007| url = http://www.bfs.admin.ch/bfs/portal/en/index/international/22/lexi.Document.116365.pdf |format = pdf | page= 18| accessdate = 12 February 2010 }}</ref> About 59.1% of the total households were owner occupied, or in other words did not pay rent (though they may have a [[Mortgage loan|mortgage]] or a [[rent-to-own]] agreement).<ref>Urban Audit Glossary pg 17</ref> |
|||
{{as of|2000}}, there were 669 private households in the municipality, and an average of 2.4 persons per household.<ref name=SFSO/> There were 182 households that consist of only one person and 34 households with five or more people. Out of a total of 672 households that answered this question, 27.1% were households made up of just one person and 3 were adults who lived with their parents. Of the rest of the households, there are 206 married couples without children, 235 married couples with children There were 33 single parents with a child or children. There were 10 households that were made up unrelated people and 3 households that were made some sort of institution or another collective housing.<ref name=STAT2000/> |
|||
{{as of|2000|alt=In 2000}} there were 354 single family homes (or 73.4% of the total) out of a total of 482 inhabited buildings. There were 78 multi-family buildings (16.2%), along with 38 multi-purpose buildings that were mostly used for housing (7.9%) and 12 other use buildings (commercial or industrial) that also had some housing (2.5%). Of the single family homes 20 were built before 1919, while 75 were built between 1990 and 2000. The greatest number of single family homes (105) were built between 1981 and 1990.<ref name=Housing>[http://www.pxweb.bfs.admin.ch/Database/German_09%20-%20Bau-%20und%20Wohnungswesen/09.2%20-%20Geb%C3%A4ude%20und%20Wohnungen/09.2%20-%20Geb%C3%A4ude%20und%20Wohnungen.asp?lang=1&prod=09&secprod=2&openChild=trueSwiss Federal Statistical Office STAT-TAB - Datenwürfel für Thema 09.2 - Gebäude und Wohnungen] {{de icon}} accessed 28 January 2011</ref> |
|||
{{as of|2000|alt=In 2000}} there were 696 apartments in the municipality. The most common apartment size was 4 rooms of which there were 221. There were 7 single room apartments and 290 apartments with five or more rooms. Of these apartments, a total of 657 apartments (94.4% of the total) were permanently occupied, while 19 apartments (2.7%) were seasonally occupied and 20 apartments (2.9%) were empty.<ref name=Housing/> {{as of|2007}}, the construction rate of new housing units was 1.7 new units per 1000 residents.<ref name=SFSO/> {{as of|2000}} the average price to rent a two room apartment was about 905.00 CHF (US$720, £410, €580), a three room apartment was about 1014.00 CHF (US$810, £460, €650) and a four room apartment cost an average of 1437.00 CHF (US$1150, £650, €920).<ref name=Rent>[http://www.statistik.bl.ch/stabl_data/stabl_generator/titel.php?thema_id=6&unterthema_id=14&titel_id=81&modular=0 Canton of Basel-Land Statistics], ''Mieter- und Genossenschafterwohnungen1 nach Zimmerzahl und Mietpreis 2000'' {{de icon}} accessed 20 February 2011</ref> The vacancy rate for the municipality, {{as of|2008|alt=in 2008}}, was 0.38%.<ref name=SFSO/> |
|||
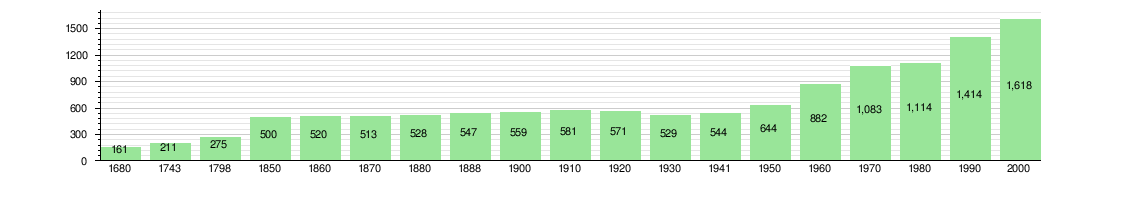
The historical population is given in the following chart:<ref name=HDS>{{HDS|1225|Itingen}}</ref><ref>[http://www.pxweb.bfs.admin.ch/Database/German_40%20-%20Eidgen%C3%B6ssische%20Volksz%C3%A4hlung/40.4%20-%201850-2000/40.4%20-%201850-2000.asp?lang=1&prod=40&secprod=4&openChild=true Swiss Federal Statistical Office STAT-TAB Bevölkerungsentwicklung nach Region, 1850-2000] {{de icon}} accessed 29 January 2011</ref> |
|||
<timeline> |
|||
Colors= |
|||
id:lightgrey value:gray(0.9) |
|||
id:darkgrey value:gray(0.8) |
|||
ImageSize = width:1140 height:210 |
|||
PlotArea = height:150 left:100 bottom:50 right:100 |
|||
AlignBars = justify |
|||
DateFormat = x.y |
|||
Period = from:0 till:1700 |
|||
TimeAxis = orientation:vertical |
|||
AlignBars = justify |
|||
ScaleMajor = gridcolor:darkgrey increment:300 start:0 |
|||
ScaleMinor = gridcolor:lightgrey increment:60 start:0 |
|||
PlotData= |
|||
color:yellowgreen width:40 mark:(line,white) align:center |
|||
bar:1680 from:start till:161 text:"161" |
|||
bar:1743 from:start till:211 text:"211" |
|||
bar:1798 from:start till:275 text:"275" |
|||
bar:1850 from:start till:500 text:"500" |
|||
bar:1860 from:start till:520 text:"520" |
|||
bar:1870 from:start till:513 text:"513" |
|||
bar:1880 from:start till:528 text:"528" |
|||
bar:1888 from:start till:547 text:"547" |
|||
bar:1900 from:start till:559 text:"559" |
|||
bar:1910 from:start till:581 text:"581" |
|||
bar:1920 from:start till:571 text:"571" |
|||
bar:1930 from:start till:529 text:"529" |
|||
bar:1941 from:start till:544 text:"544" |
|||
bar:1950 from:start till:644 text:"644" |
|||
bar:1960 from:start till:882 text:"882" |
|||
bar:1970 from:start till:1083 text:"1,083" |
|||
bar:1980 from:start till:1114 text:"1,114" |
|||
bar:1990 from:start till:1414 text:"1,414" |
|||
bar:2000 from:start till:1618 text:"1,618" |
|||
</timeline> |
|||
==Sights= |
|||
=The entire village of Itingen is designated as part of the [[Inventory of Swiss Heritage Sites]]<ref>{{cite web|url=http://www.bevoelkerungsschutz.admin.ch/internet/bs/de/home/themen/kgs/kgs_inventar/a-objekte.parsys.000101.DownloadFile.tmp/bl.pdf |title=Kantonsliste A-Objekte:Basel-Landschaft|year=2009|work=[http://www.bevoelkerungsschutz.admin.ch/internet/bs/de/home/themen/kgs/kgs_inventar.html KGS Inventar]|publisher=Federal Office of Civil Protection|language=German|accessdate=12 July 2010}}</ref> |
|||
==Politics== |
|||
In the 2007 [[Swiss federal election, 2007|federal election]] the most popular party was the [[Swiss People's Party|SVP]] which received 29.97% of the vote. The next three most popular parties were the [[Social Democratic Party of Switzerland|SP]] (25.14%), the [[FDP.The Liberals|FDP]] (19.1%) and the [[Green Party of Switzerland|Green Party]] (16.61%). In the federal election, a total of 650 votes were cast, and the [[voter turnout]] was 51.3%.<ref>[http://www.bfs.admin.ch/bfs/portal/de/index/themen/17/02/blank/data/04/03.html Swiss Federal Statistical Office, ''Nationalratswahlen 2007: Stärke der Parteien und Wahlbeteiligung, nach Gemeinden/Bezirk/Canton''] {{de icon}} accessed 28 May 2010</ref> |
|||
==Economy== |
|||
{{as of|2007|In 2007}}, Itingen had an unemployment rate of 3.57%. {{as of|2005}}, there were 8 people employed in the [[Primary sector of the economy|primary economic sector]] and about 2 businesses involved in this sector. 445 people were employed in the [[Secondary sector of the economy|secondary sector]] and there were 22 businesses in this sector. 820 people were employed in the [[Tertiary sector of the economy|tertiary sector]], with 44 businesses in this sector.<ref name=SFSO/> There were 916 residents of the municipality who were employed in some capacity, of which females made up 45.5% of the workforce. |
|||
{{as of|2008|alt=In 2008}} the total number of full-time equivalent jobs was 1,131. The number of jobs in the primary sector was 3, of which 2 were in agriculture and 1 was in forestry or lumber production. The number of jobs in the secondary sector was 384, of which 352 or (91.7%) were in manufacturing and 32 (8.3%) were in construction. The number of jobs in the tertiary sector was 744. In the tertiary sector; 47 or 6.3% were in the sale or repair of motor vehicles, 158 or 21.2% were in the movement and storage of goods, 16 or 2.2% were in a hotel or restaurant, 8 or 1.1% were in the information industry, 480 or 64.5% were technical professionals or scientists, 14 or 1.9% were in education and 9 or 1.2% were in health care.<ref>[http://www.pxweb.bfs.admin.ch/Database/German_06%20-%20Industrie%20und%20Dienstleistungen/06.2%20-%20Unternehmen/06.2%20-%20Unternehmen.asp?lang=1&prod=06&secprod=2&openChild=true Swiss Federal Statistical Office STAT-TAB Betriebszählung: Arbeitsstätten nach Gemeinde und NOGA 2008 (Abschnitte), Sektoren 1-3] {{de icon}} accessed 28 January 2011</ref> |
|||
{{as of|2000|alt=In 2000}}, there were 971 workers who commuted into the municipality and 709 workers who commuted away. The municipality is a net importer of workers, with about 1.4 workers entering the municipality for every one leaving. About 1.4% of the workforce coming into Itingen are coming from outside Switzerland.<ref name=commuter>[http://www.media-stat.admin.ch/stat/pendler/pop.php Swiss Federal Statistical Office - Statweb] {{de icon}} accessed 24 June 2010</ref> Of the working population, 23.6% used public transportation to get to work, and 50.5% used a private car.<ref name=SFSO/> |
|||
==Religion== |
|||
From the {{as of|2000|alt=2000 census}}, 404 or 25.0% were [[Roman Catholic]], while 889 or 54.9% belonged to the [[Swiss Reformed Church]]. Of the rest of the population, there were 15 [[Orthodox Christianity|members of an Orthodox church]] (or about 0.93% of the population), there were 4 individuals (or about 0.25% of the population) who belonged to the [[Christian Catholic Church of Switzerland|Christian Catholic Church]], and there were 22 individuals (or about 1.36% of the population) who belonged to another Christian church. There were 3 individuals (or about 0.19% of the population) who were [[Judaism|Jewish]], and 80 (or about 4.94% of the population) who were [[Islam]]ic. There were 2 individuals who were [[Buddhism|Buddhist]] and 1 individual who belonged to another church. 181 (or about 11.19% of the population) belonged to no church, are [[Agnosticism|agnostic]] or [[Atheism|atheist]], and 17 individuals (or about 1.05% of the population) did not answer the question.<ref name=STAT2000/> |
|||
==Education== |
|||
In Itingen about 741 or (45.8%) of the population have completed non-mandatory [[Education in Switzerland#Secondary|upper secondary education]], and 215 or (13.3%) have completed additional higher education (either [[List of universities in Switzerland|University]] or a ''[[Fachhochschule]]''). Of the 215 who completed tertiary schooling, 56.7% were Swiss men, 29.3% were Swiss women, 10.7% were non-Swiss men and 3.3% were non-Swiss women.<ref name=STAT2000/> |
|||
{{as of|2000}}, there were 6 students in Itingen who came from another municipality, while 147 residents attended schools outside the municipality.<ref name=commuter/> |
|||
==References== |
|||
| ⚫ | |||
==External links== |
==External links== |
||
| Line 39: | Line 131: | ||
[[Category:Municipalities of Basel-Country]] |
[[Category:Municipalities of Basel-Country]] |
||
[[Category:Cultural property of national significance in the canton of Basel-Country]] |
[[Category:Cultural property of national significance in the canton of Basel-Country]] |
||
{{BaselCountry-geo-stub}} |
|||
[[als:Itingen]] |
[[als:Itingen]] |
||
Revision as of 14:04, 5 March 2011
Itingen | |
|---|---|
 Coat of arms | |
Location of Itingen  | |
| Country | Switzerland |
| Canton | Basel-Country |
| District | Sissach |
| Area | |
| • Total | 3.14 km2 (1.21 sq mi) |
| Elevation | 363 m (1,191 ft) |
| Population (31 December 2018)[2] | |
| • Total | 2,157 |
| • Density | 690/km2 (1,800/sq mi) |
| Time zone | UTC+01:00 (Central European Time) |
| • Summer (DST) | UTC+02:00 (Central European Summer Time) |
| Postal code(s) | 4452 |
| SFOS number | 2849 |
| ISO 3166 code | CH-BL |
| Surrounded by | Lausen, Ramlinsburg, Sissach, Zunzgen |
| Website | www SFSO statistics |
Itingen is a municipality in the district of Sissach in the canton of Basel-Country in Switzerland.
History
Itingen is first mentioned in 1226 as Utingen. In 1454 it was mentioned as Uetingen.[3]
Geography
Itingen has an area, as of 2009[update], of Template:Km2 to mi2. Of this area, Template:Km2 to mi2 or 28.7% is used for agricultural purposes, while Template:Km2 to mi2 or 47.1% is forested. Of the rest of the land, Template:Km2 to mi2 or 23.9% is settled (buildings or roads) and 0.01 km2 (2.5 acres) or 0.3% is unproductive land.[4]
Of the built up area, industrial buildings made up 3.2% of the total area while housing and buildings made up 9.6% and transportation infrastructure made up 10.5%. Out of the forested land, 43.6% of the total land area is heavily forested and 3.5% is covered with orchards or small clusters of trees. Of the agricultural land, 11.5% is used for growing crops and 13.1% is pastures, while 4.1% is used for orchards or vine crops.[4]
The municipality is located in the Sissach district, in the mid-Ergolz valley. The old village center is located perpendicular to the old cantonal road and to the left of the Basel-Olten rail line.
Coat of arms
The blazon of the municipal coat of arms is Gules, a Fish nainaint winged Argent.[5]
Demographics
Itingen has a population (as of June 2021[update]) of 2,216.[6] As of 2008[update], 15.6% of the population are resident foreign nationals.[7] Over the last 10 years (1997-2007) the population has changed at a rate of 16.5%.[8]
Most of the population (as of 2000[update]) speaks German (1,441 or 89.1%), with Italian language being second most common (60 or 3.7%) and Serbo-Croatian being third (41 or 2.5%). There are 14 people who speak French and 2 people who speak Romansh.[9]
As of 2008[update], the gender distribution of the population was 50.5% male and 49.5% female. The population was made up of 1,545 Swiss citizens (82.7% of the population), and 323 non-Swiss residents (17.3%)[10] Of the population in the municipality 357 or about 22.1% were born in Itingen and lived there in 2000. There were 527 or 32.6% who were born in the same canton, while 448 or 27.7% were born somewhere else in Switzerland, and 262 or 16.2% were born outside of Switzerland.[9]
In 2008[update] there were 12 live births to Swiss citizens and 1 birth to non-Swiss citizens, and in same time span there were 12 deaths of Swiss citizens and 2 non-Swiss citizen deaths. Ignoring immigration and emigration, the population of Swiss citizens remained the same while the foreign population decreased by 1. There were 2 Swiss men and 2 Swiss women who immigrated back to Switzerland. At the same time, there were 8 non-Swiss men and 1 non-Swiss woman who immigrated from another country to Switzerland. The total Swiss population change in 2008 (from all sources, including moves across municipal borders) was an increase of 28 and the non-Swiss population decreased by 11 people. This represents a population growth rate of 0.9%.[7]
The age distribution, as of 2010[update], in Itingen is; 119 children or 6.4% of the population are between 0 and 6 years old and 259 teenagers or 13.9% are between 7 and 19. Of the adult population, 237 people or 12.7% of the population are between 20 and 29 years old. 258 people or 13.8% are between 30 and 39, 301 people or 16.1% are between 40 and 49, and 442 people or 23.7% are between 50 and 64. The senior population distribution is 197 people or 10.5% of the population are between 65 and 79 years old and there are 55 people or 2.9% who are over 80.[10]
As of 2000[update], there were 631 people who were single and never married in the municipality. There were 836 married individuals, 79 widows or widowers and 72 individuals who are divorced.[9]
As of 2000[update] the average number of residents per living room was 0.54 which is about equal to the cantonal average of 0.56 per room. In this case, a room is defined as space of a housing unit of at least Template:M2 to ft2 as normal bedrooms, dining rooms, living rooms, kitchens and habitable cellars and attics.[11] About 59.1% of the total households were owner occupied, or in other words did not pay rent (though they may have a mortgage or a rent-to-own agreement).[12]
As of 2000[update], there were 669 private households in the municipality, and an average of 2.4 persons per household.[8] There were 182 households that consist of only one person and 34 households with five or more people. Out of a total of 672 households that answered this question, 27.1% were households made up of just one person and 3 were adults who lived with their parents. Of the rest of the households, there are 206 married couples without children, 235 married couples with children There were 33 single parents with a child or children. There were 10 households that were made up unrelated people and 3 households that were made some sort of institution or another collective housing.[9]
In 2000[update] there were 354 single family homes (or 73.4% of the total) out of a total of 482 inhabited buildings. There were 78 multi-family buildings (16.2%), along with 38 multi-purpose buildings that were mostly used for housing (7.9%) and 12 other use buildings (commercial or industrial) that also had some housing (2.5%). Of the single family homes 20 were built before 1919, while 75 were built between 1990 and 2000. The greatest number of single family homes (105) were built between 1981 and 1990.[13]
In 2000[update] there were 696 apartments in the municipality. The most common apartment size was 4 rooms of which there were 221. There were 7 single room apartments and 290 apartments with five or more rooms. Of these apartments, a total of 657 apartments (94.4% of the total) were permanently occupied, while 19 apartments (2.7%) were seasonally occupied and 20 apartments (2.9%) were empty.[13] As of 2007[update], the construction rate of new housing units was 1.7 new units per 1000 residents.[8] As of 2000[update] the average price to rent a two room apartment was about 905.00 CHF (US$720, £410, €580), a three room apartment was about 1014.00 CHF (US$810, £460, €650) and a four room apartment cost an average of 1437.00 CHF (US$1150, £650, €920).[14] The vacancy rate for the municipality, in 2008[update], was 0.38%.[8]
The historical population is given in the following chart:[3][15]
=Sights
=The entire village of Itingen is designated as part of the Inventory of Swiss Heritage Sites[16]
Politics
In the 2007 federal election the most popular party was the SVP which received 29.97% of the vote. The next three most popular parties were the SP (25.14%), the FDP (19.1%) and the Green Party (16.61%). In the federal election, a total of 650 votes were cast, and the voter turnout was 51.3%.[17]
Economy
As of 2007[update], Itingen had an unemployment rate of 3.57%. As of 2005[update], there were 8 people employed in the primary economic sector and about 2 businesses involved in this sector. 445 people were employed in the secondary sector and there were 22 businesses in this sector. 820 people were employed in the tertiary sector, with 44 businesses in this sector.[8] There were 916 residents of the municipality who were employed in some capacity, of which females made up 45.5% of the workforce.
In 2008[update] the total number of full-time equivalent jobs was 1,131. The number of jobs in the primary sector was 3, of which 2 were in agriculture and 1 was in forestry or lumber production. The number of jobs in the secondary sector was 384, of which 352 or (91.7%) were in manufacturing and 32 (8.3%) were in construction. The number of jobs in the tertiary sector was 744. In the tertiary sector; 47 or 6.3% were in the sale or repair of motor vehicles, 158 or 21.2% were in the movement and storage of goods, 16 or 2.2% were in a hotel or restaurant, 8 or 1.1% were in the information industry, 480 or 64.5% were technical professionals or scientists, 14 or 1.9% were in education and 9 or 1.2% were in health care.[18]
In 2000[update], there were 971 workers who commuted into the municipality and 709 workers who commuted away. The municipality is a net importer of workers, with about 1.4 workers entering the municipality for every one leaving. About 1.4% of the workforce coming into Itingen are coming from outside Switzerland.[19] Of the working population, 23.6% used public transportation to get to work, and 50.5% used a private car.[8]
Religion
From the 2000 census[update], 404 or 25.0% were Roman Catholic, while 889 or 54.9% belonged to the Swiss Reformed Church. Of the rest of the population, there were 15 members of an Orthodox church (or about 0.93% of the population), there were 4 individuals (or about 0.25% of the population) who belonged to the Christian Catholic Church, and there were 22 individuals (or about 1.36% of the population) who belonged to another Christian church. There were 3 individuals (or about 0.19% of the population) who were Jewish, and 80 (or about 4.94% of the population) who were Islamic. There were 2 individuals who were Buddhist and 1 individual who belonged to another church. 181 (or about 11.19% of the population) belonged to no church, are agnostic or atheist, and 17 individuals (or about 1.05% of the population) did not answer the question.[9]
Education
In Itingen about 741 or (45.8%) of the population have completed non-mandatory upper secondary education, and 215 or (13.3%) have completed additional higher education (either University or a Fachhochschule). Of the 215 who completed tertiary schooling, 56.7% were Swiss men, 29.3% were Swiss women, 10.7% were non-Swiss men and 3.3% were non-Swiss women.[9]
As of 2000[update], there were 6 students in Itingen who came from another municipality, while 147 residents attended schools outside the municipality.[19]
References
- ^ a b "Arealstatistik Standard - Gemeinden nach 4 Hauptbereichen". Federal Statistical Office. Retrieved 13 January 2019.
- ^ "Ständige Wohnbevölkerung nach Staatsangehörigkeitskategorie Geschlecht und Gemeinde; Provisorische Jahresergebnisse; 2018". Federal Statistical Office. 9 April 2019. Retrieved 11 April 2019.
- ^ a b Itingen in German, French and Italian in the online Historical Dictionary of Switzerland.
- ^ a b Swiss Federal Statistical Office-Land Use Statistics 2009 data Template:De icon accessed 25 March 2010
- ^ Flags of the World.com accessed 05-March-2011
- ^ Canton of Basel-Land Statistics, Wohnbevölkerung nach Nationalität und Konfession per 30. Juni 2021 (in German) accessed 22 September 2021
- ^ a b Swiss Federal Statistical Office - Superweb database - Gemeinde Statistics 1981-2008 Template:De icon accessed 19 June 2010
- ^ a b c d e f Swiss Federal Statistical Office accessed 05-March-2011
- ^ a b c d e f STAT-TAB Datenwürfel für Thema 40.3 - 2000 Template:De icon accessed 2 February 2011
- ^ a b Canton of Basel-Land Statistics, Wohnbevölkerung nach Nationalität und Konfession per 30. September 2010 Template:De icon accessed 16 February 2011
- ^ Eurostat. "Housing (SA1)". Urban Audit Glossary (pdf). 2007. p. 18. Retrieved 12 February 2010.
- ^ Urban Audit Glossary pg 17
- ^ a b Federal Statistical Office STAT-TAB - Datenwürfel für Thema 09.2 - Gebäude und Wohnungen Template:De icon accessed 28 January 2011
- ^ Canton of Basel-Land Statistics, Mieter- und Genossenschafterwohnungen1 nach Zimmerzahl und Mietpreis 2000 Template:De icon accessed 20 February 2011
- ^ Swiss Federal Statistical Office STAT-TAB Bevölkerungsentwicklung nach Region, 1850-2000 Template:De icon accessed 29 January 2011
- ^ "Kantonsliste A-Objekte:Basel-Landschaft" (PDF). KGS Inventar (in German). Federal Office of Civil Protection. 2009. Retrieved 12 July 2010.
{{cite web}}: External link in|work= - ^ Swiss Federal Statistical Office, Nationalratswahlen 2007: Stärke der Parteien und Wahlbeteiligung, nach Gemeinden/Bezirk/Canton Template:De icon accessed 28 May 2010
- ^ Swiss Federal Statistical Office STAT-TAB Betriebszählung: Arbeitsstätten nach Gemeinde und NOGA 2008 (Abschnitte), Sektoren 1-3 Template:De icon accessed 28 January 2011
- ^ a b Swiss Federal Statistical Office - Statweb Template:De icon accessed 24 June 2010
External links
- Official website Template:De icon
- TV Itingen
- Itingen in German, French and Italian in the online Historical Dictionary of Switzerland.