Myrtle Beach metropolitan area
Myrtle Beach Metropolitan Area | |
|---|---|
| Myrtle Beach–Conway–North Myrtle Beach, SC Metropolitan Statistical Area | |
 Myrtle Beach shoreline | |
 | |
| Country | |
| State | |
| Largest city | Myrtle Beach |
| Other cities | |
| Area | |
• Total | 1,947 sq mi (5,042 km2) |
| Population (2023)[1] | |
• Total | 397,478 |
| • Rank | 114th in the U.S. |
| GDP | |
| • Total | $25.132 billion (2022) |
| Time zone | UTC−5 (EST) |
| • Summer (DST) | UTC−4 (EDT) |
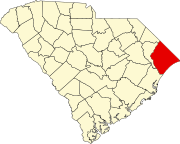
The Myrtle Beach metropolitan area (officially the Myrtle Beach–Conway–North Myrtle Beach, SC Metropolitan Statistical Area) is a census-designated metropolitan statistical area (MSA) consisting of Horry County in South Carolina. The wider Myrtle Beach combined statistical area (CSA), a trading area, includes adjacent Georgetown County, South Carolina.
From 2013 to 2023, Brunswick County, North Carolina was also a component of the Myrtle Beach MSA. In 2023, however, the Office of Management and Budget redefined the statistical area and moved Brunswick County to the Wilmington, NC Metropolitan Statistical Area.[3][4] The Myrtle Beach MSA's principal cities, ordered by population, are Myrtle Beach, Conway, and North Myrtle Beach in South Carolina. The Myrtle Beach CSA includes the city of Georgetown, South Carolina.
CSA area
[edit]Myrtle Beach combined statistical area
[edit]| County | 2022 Estimate | 2020 Census | Change |
|---|---|---|---|
| Horry County | 383,101 | 351,029 | +9.14% |
| Georgetown County | 64,722 | 63,404 | +2.08% |
| Total | 447,823 | 414,433 | +8.06% |
Largest cities and towns
[edit]| Rank | City / town | County | 2021 Estimate | 2020 Census | Change |
|---|---|---|---|---|---|
| 1 | Myrtle Beach | Horry County | 37,100 | 35,682 | +3.97% |
| 2 | Leland[a] | Brunswick County | 25,974 | 22,908 | +13.38% |
| 3 | Conway | Horry County | 23,119 | 24,849 | −6.96% |
| 4 | North Myrtle Beach | Horry County | 19,485 | 18,790 | +3.70% |
| 5 | Oak Island[a] | Brunswick County | 8,878 | 8,396 | +5.74% |
| 6 | Georgetown | Georgetown County | 8,333 | 8,403 | −0.83% |
| 7 | St. James[a] | Brunswick County | 6,913 | 6,529 | +5.88% |
| 8 | Boiling Spring Lakes[a] | Brunswick County | 6,168 | 5,943 | +3.79% |
| 9 | Carolina Shores[a] | Brunswick County | 4,763 | 4,588 | +3.81% |
| 10 | Surfside Beach | Horry County | 4,253 | 4,155 | +2.36% |
CSA demographics
[edit]| Year | Population[5] | Growth | Counties Included |
|---|---|---|---|
| 1970 | 69,992 | --- | Horry, Georgetown |
| 1980 | 101,419 | 44.90% | Horry, Georgetown |
| 1990 | 144,053 | 42.04% | Horry, Georgetown |
| 2000 | 196,629 | 36.50% | Horry, Georgetown |
| 2010 | 329,449 | 67.50% | Horry, Georgetown |
| 2020 | 414,433 | 25.80% | Horry, Georgetown |
See also
[edit]Notes
[edit]References
[edit]- ^ [1] Archived October 16, 2013, at the Wayback Machine
- ^ "Total Gross Domestic Product for Myrtle Beach-Conway-North Myrtle Beach, SC-NC (MSA)". Federal Reserve Economic Data. Federal Reserve Bank of St. Louis.
- ^ a b Still, Johanna F. (July 21, 2023). "Brunswick back in Wilmington MSA". WilmingtonBiz. Retrieved July 26, 2023.
- ^ a b "OMB Bulletin No. 23-01: Revised Delineations of Metropolitan Statistical Areas, Micropolitan Statistical Areas, and Combined Statistical Areas, and Guidance on Uses of the Delineations of These Areas" (PDF). United States Office of Management and Budget. July 21, 2023. Retrieved August 10, 2023.
- ^ "Myrtle Beach-Conway-North Myrtle Beach, SC Metropolitan Statistical Area (CBSA) Population and Components of Change". Archived from the original on 2009-02-18. Retrieved 2009-06-21.
33°35′20″N 79°03′18″W / 33.589°N 79.055°W


