Floriano, Piauí
Floriano | |
|---|---|
Municipality | |
| Nickname: Princesa do Sul | |
| Motto: Labor signum nostrum est — Work is our sign | |
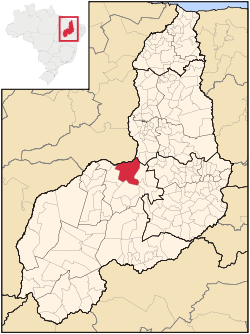
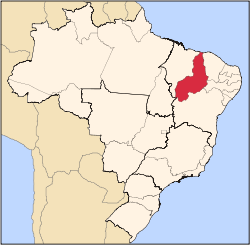
 Location of Floriano in the State of Piauí | |
 | |
| Coordinates: 6°46′01″S 43°01′22″W / 6.76694°S 43.02278°W | |
| Country | |
| Region | Northeast |
| State | |
| Founded | July 8, 1897 |
| Government | |
| • Mayor | Antônio Reis Neto (/Democracia Cristâ, 2021 – 2024) |
| Area | |
| • Total | 3,409.664 km2 (1,316.479 sq mi) |
| Elevation | 112 m (367 ft) |
| Population (2020 [1]) | |
| • Total | 60,025 |
| • Density | 17.2/km2 (45/sq mi) |
| Time zone | UTC−3 (BRT) |
| HDI | 0.711 – medium [2] |
| Website | [1] |
Floriano is a Brazilian municipality in the state of Piauí. It was founded by the Arabs and Syrians. It is situated in the physiographic zone of the Médio Parnaíba, on the right side of the Parnaíba River, in front of the city of Barão de Grajaú, in the Maranhão. It is also intersected by the rivers Gurguéia and Itaueira.
Climate[edit]
| Climate data for Floriano (1991–2020) | |||||||||||||
|---|---|---|---|---|---|---|---|---|---|---|---|---|---|
| Month | Jan | Feb | Mar | Apr | May | Jun | Jul | Aug | Sep | Oct | Nov | Dec | Year |
| Mean daily maximum °C (°F) | 32.7 (90.9) |
32.2 (90.0) |
32.3 (90.1) |
32.7 (90.9) |
33.5 (92.3) |
34.2 (93.6) |
34.9 (94.8) |
36.3 (97.3) |
37.6 (99.7) |
37.7 (99.9) |
35.7 (96.3) |
34.1 (93.4) |
34.5 (94.1) |
| Mean daily minimum °C (°F) | 22.8 (73.0) |
22.6 (72.7) |
22.8 (73.0) |
22.8 (73.0) |
22.4 (72.3) |
21.8 (71.2) |
22.1 (71.8) |
23.3 (73.9) |
24.6 (76.3) |
25.1 (77.2) |
24.3 (75.7) |
23.5 (74.3) |
23.2 (73.8) |
| Average precipitation mm (inches) | 187.0 (7.36) |
164.0 (6.46) |
183.3 (7.22) |
127.9 (5.04) |
51.9 (2.04) |
6.1 (0.24) |
4.3 (0.17) |
0.5 (0.02) |
11.9 (0.47) |
49.0 (1.93) |
77.4 (3.05) |
119.1 (4.69) |
982.4 (38.68) |
| Average precipitation days (≥ 1.0 mm) | 13 | 13 | 14 | 10 | 5 | 1 | 0 | 0 | 1 | 4 | 7 | 9 | 77 |
| Average relative humidity (%) | 77.9 | 80.3 | 81.6 | 78.8 | 70.6 | 59.0 | 48.9 | 42.6 | 40.3 | 46.4 | 60.2 | 69.1 | 63.0 |
| Mean monthly sunshine hours | 163.6 | 150.8 | 170.1 | 201.9 | 249.8 | 271.9 | 295.6 | 318.1 | 297.6 | 277.7 | 219.1 | 198.9 | 2,815.1 |
| Source: Instituto Nacional de Meteorologia[3][4][5][6][7][8][9] | |||||||||||||
References[edit]
- ^ IBGE 2020
- ^ "Ranking decrescente do IDH-M dos municípios do Brasil". Atlas do Desenvolvimento Humano. Programa das Nações Unidas para o Desenvolvimento (PNUD). 2000. Archived from the original on 3 October 2009. Retrieved 11 October 2008.
- ^ "Temperatura Máxima Mensal e Anual (°C)". Normais Climatológicas do Brasil 1991-2020 (in Portuguese). Instituto Nacional de Meteorologia. Archived from the original on 24 March 2022. Retrieved 20 May 2024.
- ^ "Temperatura Média Compensada Mensal e Anual (°C)". Normais Climatológicas do Brasil 1991-2020 (in Portuguese). Instituto Nacional de Meteorologia. Archived from the original on 24 March 2022. Retrieved 20 May 2024.
- ^ "Temperatura Mínima Mensal e Anual (°C)". Normais Climatológicas do Brasil 1991-2020 (in Portuguese). Instituto Nacional de Meteorologia. Archived from the original on 24 March 2022. Retrieved 20 May 2024.
- ^ "Precipitação Acumulada Mensal e Anual (mm)". Normais Climatológicas do Brasil 1991-2020 (in Portuguese). Instituto Nacional de Meteorologia. Archived from the original on 24 March 2022. Retrieved 20 May 2024.
- ^ "Número de dias no mês ou no ano com precipitação maior ou igual a (1 mm) (dias)". Normais Climatológicas do Brasil 1991-2020 (in Portuguese). Instituto Nacional de Meteorologia. Archived from the original on 24 March 2022. Retrieved 20 May 2024.
- ^ "Umidade Relativa do Ar Compensada Mensal e Anual (%)". Normais Climatológicas do Brasil 1991-2020 (in Portuguese). Instituto Nacional de Meteorologia. Archived from the original on 24 March 2022. Retrieved 20 May 2024.
- ^ "Insolação Total (horas)". Normais Climatológicas do Brasil 1991-2020 (in Portuguese). Instituto Nacional de Meteorologia. Archived from the original on 24 March 2022. Retrieved 20 May 2024.
External links[edit]
- Atlas Digital do Piauí (PDF), detailed facts about the municipalities in Piauí.


