
File:UK CO2 emissions by sector (1990-2019).png

Size of this preview: 800 × 483 pixels. Other resolutions: 320 × 193 pixels | 640 × 386 pixels | 1,024 × 618 pixels | 1,280 × 773 pixels | 3,360 × 2,028 pixels.
Original file (3,360 × 2,028 pixels, file size: 221 KB, MIME type: image/png)
| This is a file from the Wikimedia Commons. Information from its description page there is shown below. Commons is a freely licensed media file repository. You can help. |
Summary
| Description |
English: A stacked area plot of carbon dioxide emissions in the UK from 1990 to 2019. The net negative impact of "land use, land use change and forestry" is not shown. Provisional emissions estimates are used for the 2019 figures. Data taken from from the provisional UK greenhouse gas emissions national statistics. |
| Date | |
| Source | Own work |
| Author | Negligble mass |
Licensing
I, the copyright holder of this work, hereby publish it under the following license:
This file is licensed under the Creative Commons Attribution-Share Alike 4.0 International license.
- You are free:
- to share – to copy, distribute and transmit the work
- to remix – to adapt the work
- Under the following conditions:
- attribution – You must give appropriate credit, provide a link to the license, and indicate if changes were made. You may do so in any reasonable manner, but not in any way that suggests the licensor endorses you or your use.
- share alike – If you remix, transform, or build upon the material, you must distribute your contributions under the same or compatible license as the original.
File history
Click on a date/time to view the file as it appeared at that time.
| Date/Time | Thumbnail | Dimensions | User | Comment | |
|---|---|---|---|---|---|
| current | 13:26, 2 September 2020 | 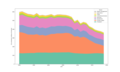 | 3,360 × 2,028 (221 KB) | Negligble mass | Uploaded own work with UploadWizard |
File usage
The following pages on the English Wikipedia use this file (pages on other projects are not listed):