
File:Paid employees by us sector 1997-2007.svg
Size of this PNG preview of this SVG file: 800 × 324 pixels. Other resolutions: 320 × 130 pixels | 640 × 259 pixels | 1,024 × 415 pixels | 1,280 × 518 pixels | 2,560 × 1,036 pixels | 1,361 × 551 pixels.
Original file (SVG file, nominally 1,361 × 551 pixels, file size: 113 KB)
| This is a file from the Wikimedia Commons. Information from its description page there is shown below. Commons is a freely licensed media file repository. You can help. |
| Description |
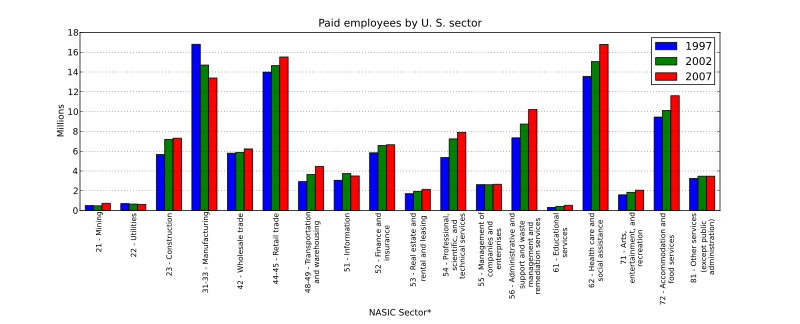
English: The economic sectors of the United States of America in the years 1997, 2002, and 2007 listed by number of paid employees. |
||
| Date | 14:48, 4 November 2012 (UTC) | ||
| Source | self-made using matplotlib[1]. Data are from U. S. Census Bureau Core Business Statistics Series[2][3]. Dollar amounts were adjusted to 2007 dollars by Consumer Price Index[4] | ||
| Author | Frodlimt (talk) | ||
| Permission (Reusing this file) |
|
References
- ↑ http://matplotlib.org/
- ↑ http://factfinder2.census.gov/faces/tableservices/jsf/pages/productview.xhtml?pid=ECN_2007_US_00CCOMP1&prodType=table
- ↑ http://factfinder2.census.gov/faces/tableservices/jsf/pages/productview.xhtml?pid=ECN_2002_US_00CCOMP1&prodType=table
- ↑ ftp://ftp.bls.gov/pub/special.requests/cpi/cpiai.txt

|
This media file is uncategorized.
Please help improve this media file by adding it to one or more categories, so it may be associated with related media files (how?), and so that it can be more easily found.
Please notify the uploader with {{subst:Please link images|File:Paid employees by us sector 1997-2007.svg}} ~~~~ |
File history
Click on a date/time to view the file as it appeared at that time.
| Date/Time | Thumbnail | Dimensions | User | Comment | |
|---|---|---|---|---|---|
| current | 14:48, 4 November 2012 | 1,361 × 551 (113 KB) | Frodlimt | {{Information |Description = The economic sectors of the United States of America in the years 1997, 2002, and 2007 listed by number of paid employees. |Source = self-made using matplotlib<ref>http://matplotlib.org/</ref>. Data are from U. S. Census B... |
File usage
The following pages on the English Wikipedia use this file (pages on other projects are not listed):