
File:Nuclear energy generation.svg

Original file (SVG file, nominally 642 × 525 pixels, file size: 11 KB)
| This is a file from the Wikimedia Commons. Information from its description page there is shown below. Commons is a freely licensed media file repository. You can help. |
This file is translated using SVG <switch> elements. All translations are stored in the same file! Learn more.
For most Wikipedia projects, you can embed the file normally (without a To translate the text into your language, you can use the SVG Translate tool. Alternatively, you can download the file to your computer, add your translations using whatever software you're familiar with, and re-upload it with the same name. You will find help in Graphics Lab if you're not sure how to do this. |
Summary
| Description |
English: This plot shows the rate of nuclear energy generation (ε) for a main sequence star as a function of temperature (T). The green curve shows the proton-proton cycle, blue is the CNO cycle and red is the triple-α process. The brown vertical line represents the core temperature of the Sun, demonstrating that the P-P chain is the primary source of energy generation. The dashed line joining the P-P curve to the CNO cycle represents the net energy generation rate of the combined nuclear hydrogen burning cycles. The slope of the curves shows the greater temperature sensitivity of the CNO cycle and triple-α process. It supports automatic language switch betwween en and any among de el fr it ja mk nl pt ru zh.
Italiano: Questo grafico mostra il tasso di generazione di energia nucleare (ε) per una stella della sequenza principale in funzione della temperatura (T). La linea verde rappresenta la catena protone-protone (PP), quella blu il ciclo carbonio-azoto-ossigeno (CNO), quella rossa il processo tre alfa (3-&alpha). La linea marrone indica la temperatura del nucleo del Sole evidenziando come sia la catena protone-protone la reazione prevalente. La linea tratteggiata che unisce la curva PP a quella CNO rappresenta il l'energia totale prodotat a quelle temperature dai vari processi. La pendenza delle linee evidenza come i processi CNO e 3-&alpha siano più sensibili alle variazioni di temperatura. Il grafico gestisce automaticamente la rappresentazione nelle seguenti lingue: en (default), de el fr it ja mk nl pt ru zh. |
| Date | |
| Source | Own work. See reference below. |
| Author | RJHall |
| Other versions |
|
| SVG development | This diagram was created with Inkscape, or with something else. This diagram uses embedded text that can be easily translated using a text editor. |
Reference
- After: Schwarzschild, Martin (1958) Structure and Evolution of the Stars (Dover edition (1965) ed.), Princeton University Press, pp. 82 ISBN: 0-486-61479-4.
Licensing
- You are free:
- to share – to copy, distribute and transmit the work
- to remix – to adapt the work
- Under the following conditions:
- attribution – You must give appropriate credit, provide a link to the license, and indicate if changes were made. You may do so in any reasonable manner, but not in any way that suggests the licensor endorses you or your use.
- share alike – If you remix, transform, or build upon the material, you must distribute your contributions under the same or compatible license as the original.

|
Permission is granted to copy, distribute and/or modify this document under the terms of the GNU Free Documentation License, Version 1.2 or any later version published by the Free Software Foundation; with no Invariant Sections, no Front-Cover Texts, and no Back-Cover Texts. A copy of the license is included in the section entitled GNU Free Documentation License. |
File history
Click on a date/time to view the file as it appeared at that time.
| Date/Time | Thumbnail | Dimensions | User | Comment | |
|---|---|---|---|---|---|
| current | 20:54, 7 March 2021 |  | 642 × 525 (11 KB) | Ysogo | Changed text-anchor to smoothly handle the different lenghts of word |
| 20:21, 7 March 2021 | 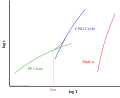 | 642 × 525 (11 KB) | Ysogo | Added labels in de el fr ja mk nl pt ru zh | |
| 08:27, 7 March 2021 |  | 642 × 525 (8 KB) | Ysogo | Added language autoswitch English-Italian | |
| 03:44, 6 December 2008 |  | 642 × 525 (8 KB) | RJHall | {{Information |Description=Nucler energy generation versus temperature. |Source=self-made |Date= |Author= RJHall |Permission= |other_versions= }} Category:Astrophysics Category:Nuclear fusion |
File usage
Global file usage
The following other wikis use this file:
- Usage on bn.wikipedia.org
- Usage on el.wikipedia.org
- Usage on es.wikipedia.org
- Usage on fr.wikipedia.org
- Usage on fr.wikibooks.org
- Usage on ig.wikipedia.org
- Usage on it.wikipedia.org
- Usage on ja.wikipedia.org
- Usage on nl.wikipedia.org
- Usage on pnb.wikipedia.org
- Usage on pt.wikipedia.org
- Usage on ru.wikipedia.org
- Usage on uk.wikipedia.org
- Usage on ur.wikipedia.org
- Usage on zh.wikipedia.org