
File:Daily new confirmed COVID-19 deaths per million people.svg

Size of this PNG preview of this SVG file: 800 × 565 pixels. Other resolutions: 320 × 226 pixels | 640 × 452 pixels | 1,024 × 723 pixels | 1,280 × 904 pixels | 2,560 × 1,807 pixels.
Original file (SVG file, nominally 850 × 600 pixels, file size: 165 KB)
| This is a file from the Wikimedia Commons. Information from its description page there is shown below. Commons is a freely licensed media file repository. You can help. |
Summary
| Description |
English: World map of daily new confirmed COVID-19 deaths per million people by country. Rolling 7-day average. See the file history farther down for the latest date. |
| Date | is the date of the first upload to the Commons. See the file history below for the most recent upload date. Please upload new versions. Use the upload link at the end of the file history list. |
| Source | https://ourworldindata.org/explorers/coronavirus-data-explorer?tab=map&Metric=Confirmed+deaths&Interval=7-day+rolling+average&Relative+to+Population=true&Align+outbreaks=false&country=~OWID_WRL - Click on the map tab. Then click the download tab, and the SVG link to get the SVG file. The table tab has a table of the exact data by country. The sources tab says the data is from the COVID-19 Data Repository by the Center for Systems Science and Engineering (CSSE) at Johns Hopkins University. The map at the source is interactive and provides more detail. The chart tab has a timeline graph of the rate of worldwide daily new deaths per million people. |
| Author | Our World In Data. See Wikipedia: Our World in Data. |
| Other versions | File:World map of daily new confirmed COVID-19 deaths per million people by country.png |
Licensing
This file is licensed under the Creative Commons Attribution-Share Alike 4.0 International license.
- You are free:
- to share – to copy, distribute and transmit the work
- to remix – to adapt the work
- Under the following conditions:
- attribution – You must give appropriate credit, provide a link to the license, and indicate if changes were made. You may do so in any reasonable manner, but not in any way that suggests the licensor endorses you or your use.
- share alike – If you remix, transform, or build upon the material, you must distribute your contributions under the same or compatible license as the original.
File history
Click on a date/time to view the file as it appeared at that time.
| Date/Time | Thumbnail | Dimensions | User | Comment | |
|---|---|---|---|---|---|
| current | 18:57, 8 August 2023 |  | 850 × 600 (165 KB) | Timeshifter | Latest |
| 22:19, 8 July 2023 | 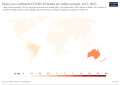 | 850 × 600 (165 KB) | Timeshifter | Latest | |
| 08:45, 19 May 2023 | 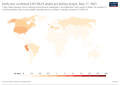 | 850 × 600 (164 KB) | Timeshifter | Latest | |
| 03:05, 26 March 2023 |  | 850 × 600 (164 KB) | Timeshifter | lLatest. OWID added Liberation Sans font. Fixed caption overlap problem. See: w:Wikipedia:SVG help#font-family issues | |
| 14:56, 20 March 2022 | 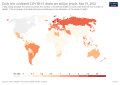 | 850 × 600 (169 KB) | Timeshifter | Latest map from source. | |
| 20:51, 8 February 2022 | 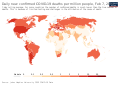 | 850 × 600 (169 KB) | Timeshifter | Latest map from source. | |
| 23:12, 28 December 2021 | 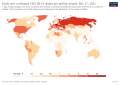 | 850 × 600 (168 KB) | Timeshifter | Latest map from source. | |
| 00:34, 24 September 2021 |  | 850 × 600 (168 KB) | Timeshifter | Latest map from source. | |
| 23:51, 28 September 2020 |  | 850 × 600 (127 KB) | Investigatory | Uploaded a work by Our World In Data from https://ourworldindata.org/coronavirus-data-explorer?tab=map&yScale=log&zoomToSelection=true&time=2020-09-17&country=®ion=World&deathsMetric=true&interval=smoothed&hideControls=true&perCapita=true&smoothing=7&pickerMetric=location&pickerSort=asc with UploadWizard |
File usage
The following pages on the English Wikipedia use this file (pages on other projects are not listed):
Global file usage
The following other wikis use this file:
- Usage on az.wikipedia.org
- Usage on ml.wikipedia.org
- Usage on vi.wikipedia.org