
File:COVID-19 Tests in Peru per 100,000 inhabitants.svg

Original file (SVG file, nominally 512 × 724 pixels, file size: 76 KB)
| This is a file from the Wikimedia Commons. Information from its description page there is shown below. Commons is a freely licensed media file repository. You can help. |
Summary
| Description |
Español: Mapa de pruebas COVID-19 realizadas por departamentos por 100 000 habitantes.
English: Map of COVID-19 tests carried out by departments per 100,000 inhabitants. |
| Date | |
| Source | Own work, data from Sala Situacional COVID-19 Perú, Gobierno del Perú - MINSA. |
| Author | Antonio Escobar, Carlos Pozo |
Español: Este gráfico ha sido elaborado con los datos proporcionados por la Dirección General de Epidemiología del Ministerio de Salud, el dato reflejado en el gráfico indica la cantidad total de pruebas realizadas por cada cien mil habitantes en las 26 áreas administrativas del país.
English: This graph has been prepared with the data provided by the General Directorate of Epidemiology of the Ministry of Health, the data reflected in the graph indicates the total amount of tests carried out per hundred thousand inhabitants in the 26 administrative areas of the country.
Licensing
- You are free:
- to share – to copy, distribute and transmit the work
- to remix – to adapt the work
- Under the following conditions:
- attribution – You must give appropriate credit, provide a link to the license, and indicate if changes were made. You may do so in any reasonable manner, but not in any way that suggests the licensor endorses you or your use.
- share alike – If you remix, transform, or build upon the material, you must distribute your contributions under the same or compatible license as the original.
File history
Click on a date/time to view the file as it appeared at that time.
| Date/Time | Thumbnail | Dimensions | User | Comment | |
|---|---|---|---|---|---|
| current | 06:36, 3 January 2022 |  | 512 × 724 (76 KB) | CarlosEduardoPA | Update 2022-01-01 |
| 07:06, 17 December 2021 |  | 512 × 724 (76 KB) | CarlosEduardoPA | Update 2021-12-01 | |
| 19:59, 3 May 2021 |  | 512 × 724 (80 KB) | Antonio Eco | Update. May 2, 2021. | |
| 02:13, 14 April 2021 |  | 512 × 724 (80 KB) | Antonio Eco | Update. April 11, 2021. | |
| 04:19, 9 February 2021 |  | 512 × 724 (155 KB) | Antonio Eco | Update. February 7, 2021. | |
| 05:15, 29 January 2021 |  | 512 × 724 (155 KB) | Antonio Eco | Update. January 27, 2021. | |
| 17:39, 10 September 2020 |  | 512 × 724 (155 KB) | Antonio Eco | Update, September 8. | |
| 02:18, 6 September 2020 | 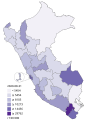 | 512 × 724 (155 KB) | Antonio Eco | Update map. | |
| 05:38, 2 September 2020 | 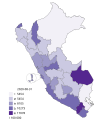 | 512 × 572 (156 KB) | Antonio Eco | Update, August 31. | |
| 20:54, 25 August 2020 |  | 512 × 572 (156 KB) | Antonio Eco | Update, August 24. |
File usage
Global file usage
The following other wikis use this file:
- Usage on es.wikipedia.org
- Usage on pt.wikipedia.org