
File:Arctic Ice Shift Graph.png
No higher resolution available.
Arctic_Ice_Shift_Graph.png (630 × 429 pixels, file size: 39 KB, MIME type: image/png)
Summary[edit]
| Description |
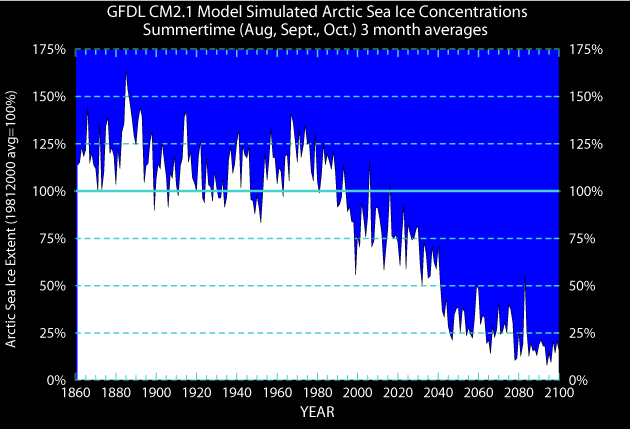
Explains graphically the levels of Arctic sea ice melting per year. Summertime Arctic-wide sea ice extent simulated by the GFDL CM2.1 model for the historical period 1860 to 2000 and projected for the 21st century following the SRES A1B emissions scenario. Sea ice extent values are normalized (scaled) so that the average for years 1981 to 2000 is equal to 100%. Totally ice free summer conditions would equal 0%. |
|---|---|
| Source | |
| Date | |
| Author |
Remik Ziemlinski and Keith Dixon/ NOAA |
| Permission (Reusing this file) |
See below.
|
Licensing[edit]
| This image is a work of the National Oceanic and Atmospheric Administration, taken or made as part of that person's official duties. As works of the U.S. federal government, all NOAA images are in the public domain in the United States. |
| This image is ineligible for copyright and therefore is in the public domain, because it consists entirely of information that is common property and contains no original authorship. |
File history
Click on a date/time to view the file as it appeared at that time.
| Date/Time | Thumbnail | Dimensions | User | Comment | |
|---|---|---|---|---|---|
| current | 02:40, 25 November 2023 |  | 630 × 429 (39 KB) | Wikiacc (talk | contribs) | Reverted to version as of 21:06, 24 April 2012 (UTC) |
| 00:52, 30 May 2017 |  | 383 × 260 (67 KB) | DatBot (talk | contribs) | Reduce size of non-free image (BOT - disable) | |
| 21:06, 24 April 2012 |  | 630 × 429 (39 KB) | Viamars (talk | contribs) | Uploading an excerpt from a non-free work using File Upload Wizard |
You cannot overwrite this file.
File usage
The following pages on the English Wikipedia use this file (pages on other projects are not listed):