
File:Sampling the Discrete-time Fourier transform.svg

Original file (SVG file, nominally 754 × 562 pixels, file size: 46 KB)
| This is a file from the Wikimedia Commons. Information from its description page there is shown below. Commons is a freely licensed media file repository. You can help. |
Summary
| Description |
English: Definitions: DTFT=discrete-time Fourier transform; DFT=discrete Fourier transform Nine symmetric samples of a cosine function are shifted from the finite Fourier transform domain [-4,4] to the DFT domain [0,8], causing its DTFT to become complex-valued, except at the frequencies of an 8-length DFT. Pictured here are the real and imaginary parts of the DTFT after the cosine is multiplied by a symmetric Gaussian window function. Also shown (in red) are the estimates obtained by deleting the 9th data sample (equivalent to applying an 8-length DFT-even (aka periodic) window) and performing an 8-length DFT. The imaginary parts of the estimates exactly match the zero-valued DTFT function, which Harris[1] attributes to "DFT-even symmetry". But the real parts have a negative bias. Increasing the gain of the window function (the sum of its coefficients) improves the one positive-value estimate, but degrades the four negative ones. |
|||
| Date | ||||
| Source | Own work | |||
| Author | Bob K | |||
| Permission (Reusing this file) |
I, the copyright holder of this work, hereby publish it under the following license:
|
|||
| Other versions | Also see File:Comparison_of_symmetric_and_periodic_Gaussian_windows.svg. | |||
| Usage | Additional information can be found at Window_function#DFT-symmetry. And Sampling the DTFT links to this image. | |||
| SVG development | V This W3C-invalid vector image was created with GNU Octave. |
|||
| Gnu Octave source | click to expand
This graphic was created by the following Octave script: pkg load signal
graphics_toolkit gnuplot
%=======================================================
function out=gauss(M2,sigma) % window function
out = exp(-.5*(((0:M2)-M2/2)/(sigma*M2/2)).^2);
endfunction
%=======================================================
% Dimensions of figure
x1 = .07; % left margin
x2 = .02; % right margin
y1 = .07; % bottom margin for annotation
y2 = .07; % top margin for title
width = 1-x1-x2;
height= 1-y1-y2;
x_origin = x1;
y_origin = 1; % start at top of graph area
%=======================================================
set(0, "DefaultAxesFontsize",12)
set(0, "DefaultTextFontsize",14)
figure("position",[50 100 800 600]);
y_origin = y_origin -y2 -height; % position of top row
subplot("position",[x_origin y_origin width height])
N = 8*9*10;
M = 4; % finite Fourier transform domain is [-M,M]
M2 = 2*M;
M21 = M2+1; % sequence length
symmetric = gauss(M2,1);
symmetric = symmetric/sum(symmetric);
periodic = symmetric(1:M2);
periodic = periodic/sum(periodic);
% A similar window is:
% window = kaiser(M21+2, pi*.75)';
% window = window(2:end-1); % Remove zero-valued end points
x = 0:M2;
y = cos(2*pi*x/4);
y_sym = y.*symmetric;
y_even = y(1:end-1).*periodic;
DTFT = fft(y_sym,N);
DFT = fft([y_sym(1)+y_sym(end) y_sym(2:end-1)]); % periodic summation
DFTeven = fft(y_even); % truncation (aka "DFT-even")
x = 0:N/2;
plot(x, real(DTFT(1+x)), "color","blue")
hold on
plot(x, imag(DTFT(1+x)), "color","blue", "linestyle","--")
set(gca, "xaxislocation","origin")
xlim([0 N/2])
ylim([-0.4 0.6])
x = (0:M);
DFT = DFT(1+x);
DFTeven = DFTeven(1+x);
x = x*N/M2;
plot(x, real(DFT), "color","blue", "o", "markersize",8, "linewidth",2)
plot(x, real(DFTeven), "color","red", "*", "markersize",4, "linewidth",2)
plot(x, imag(DFT), "color","blue", "o", "markersize",8, "linewidth",2)
plot(x, imag(DFTeven), "color","red", "*", "markersize",4, "linewidth",2)
h = legend("DTFT real",...
"DTFT imaginary",...
"periodic summation",...
"DFT-even (truncation)", "location","northeast");
set(h, "fontsize",10)
%legend boxoff
set(gca, "xtick", x, "xgrid","on", "xticklabel",[0 1 2 3 4])
xlabel("DFT bins", "fontsize",14)
ylabel("amplitude")
title("Sampling the Discrete-time Fourier transform", "fontsize",14);
|
|||
| References |
|
File history
Click on a date/time to view the file as it appeared at that time.
| Date/Time | Thumbnail | Dimensions | User | Comment | |
|---|---|---|---|---|---|
| current | 16:02, 19 August 2020 | 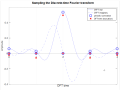 | 754 × 562 (46 KB) | Bob K | make some objects darker |
| 13:49, 19 August 2020 | 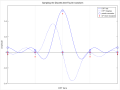 | 754 × 562 (53 KB) | Bob K | Normalize DFT-even window coefficients. Change graph symbols. | |
| 13:32, 28 March 2020 | 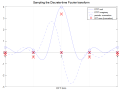 | 754 × 562 (47 KB) | Bob K | replace Hamming with a Gaussian to emphasize the difference between summation and truncation | |
| 16:06, 25 March 2020 |  | 754 × 562 (41 KB) | Bob K | Uploaded own work with UploadWizard |