Jump to content

File:BankingCrises.svg

Page contents not supported in other languages.
This is a file from the Wikimedia Commons
From Wikipedia, the free encyclopedia

Original file (SVG file, nominally 630 × 630 pixels, file size: 101 KB)

Summary

Description
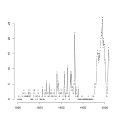
English: Number of countries having a banking crisis in each year since 1800. This is based on This time is different: Eight centuries of financial folly, which covers only 70 countries. The general upward trend might be attributed to many factors. One of these is a gradual increase in the percent of people who receive money for their labor. The dramatic feature of this graph is the virtual absence of banking crises during the period of the Bretton Woods agreement, 1945 to 1971. This analysis is similar to Figure 10.1 in Reinhart and Rogoff (2009). For more details see the help file for "bankingCrises" in the Ecdat package available from the Comprehensive R Archive Network (CRAN).
Español: Número de países que tienen una crisis bancaria en cada año desde 1800 en adelante. Esta información se basa en el libro This time is different: Eight centuries of financial folly (ref: [Reinhart-Rogoff-2009] Carmen M. Reinhart, Kenneth S. Rogoff, This Time Is Different: Eight Centuries of Financial Folly, Princeton University Press, 2009, ISBN 1400831725 y 9781400831722, 512 páginas, texto parcial en línea), donde se maneja información solamente de unos 70 países. La tendencia al alza general que se observa en esta figura, podría atribuirse a muchos factores, y uno de ellos es el aumento gradual en el porcentaje de personas que reciben dinero por su tarea o trabajo. El aspecto llamativo de este gráfico es la virtual ausencia de crisis bancarias durante el período de aplicación de los Acuerdos de Bretton Woods (1945-1971). Este análisis es similar al que se presenta en la figura 10.1 en la publicación [Reinhart-Rogoff-2009].
Deutsch: Anzahl der Länder mit eine Bankenkrise in jedem Jahr seit 1800. Dies basiert auf This time is different: Eight centuries of financial folly, die nur 70 Ländern umfasst. Der allgemeine Aufwärtstrend könnte auf viele Faktoren zurückzuführen. Dazu gehört eine schrittweise Erhöhung der Prozent der Menschen, die Geld für ihre Arbeit erhalten. Das dramatische Merkmal dieses Graphen ist fast keine Bankenkrisen im Zeitraum des Bretton-Woods-Abkommens 1945 bis 1971. Diese Analyse ist vergleichbar mit Abbildung 10.1 in Reinhart und Rogoff (2009). Weitere Informationen finden Sie unter die Hilfe-Datei für bankingCrises in das Ecdat-Paket von der Comprehensive R Archive Network (CRAN).
Français : Nombre de pays ayant une crise bancaire chaque année depuis 1800. Ceci est basé sur This time is different: Eight centuries of financial folly, qui couvre seulement 70 pays. La tendance générale à la hausse pourrait être attribuée à plusieurs facteurs. L'une d'entre elles est une augmentation progressive du pourcentage de personnes qui reçoivent de l'argent pour leur travail. L'aspect dramatique de cette figure est la quasi-absence de crises bancaires au cours de la période des w:accords de Bretton Woods, 1945 à 1971. Cette analyse est similaire à la Figure 10.1 Reinhart et Rogoff (2009). Pour plus de détails, consultez le fichier d'aide pour bankingCrises dans l'ensemble de Ecdat disponible sur le Comprehensive R Archive Network (CRAN).
Date
Source Own work
Author DavidMCEddy

Licensing

I, the copyright holder of this work, hereby publish it under the following license:
w:en:Creative Commons
attribution share alike
This file is licensed under the Creative Commons Attribution-Share Alike 3.0 Unported license.
You are free:
  • to share – to copy, distribute and transmit the work
  • to remix – to adapt the work
Under the following conditions:
  • attribution – You must give appropriate credit, provide a link to the license, and indicate if changes were made. You may do so in any reasonable manner, but not in any way that suggests the licensor endorses you or your use.
  • share alike – If you remix, transform, or build upon the material, you must distribute your contributions under the same or compatible license as the original.

Captions

Add a one-line explanation of what this file represents

Items portrayed in this file

depicts

15 February 2013

image/svg+xml

b0f4a877e1796c42def3e56078c5700dd3bc7fa6

103,786 byte

630 pixel

630 pixel

File history

Click on a date/time to view the file as it appeared at that time.

Date/TimeThumbnailDimensionsUserComment
current21:15, 20 February 2013Thumbnail for version as of 21:15, 20 February 2013630 × 630 (101 KB)DavidMCEddylarger font in axes labels + mark "Bretton Woods" period
21:43, 15 February 2013Thumbnail for version as of 21:43, 15 February 2013630 × 630 (93 KB)DavidMCEddyUser created page with UploadWizard

Global file usage

Metadata